
Pensions dashboards social research: initial outcomes report
1. Executive summary
This report presents interim findings from a longitudinal study assessing consumers’ initial use and experience of the MoneyHelper Pensions Dashboard, its early outcomes, and intended next steps. The key findings to date are summarised below.
1.1 Dashboard reach and usage
Use of the MoneyHelper Pensions Dashboard (MHPD) was shaped by both consumers' level of motivation to engage with their pensions information, and the practical challenges encountered during the access journey. Uptake was highest among those already engaged with their pensions, while practical barriers limited completion among a broader group of consumers who nevertheless recognised the potential value of the service. (Pension engagement refers to participants’ reported attitudes and behaviours relating to pensions and retirement planning. It was measured using questions covering activities such as reviewing pension information, checking pension values or contributions, considering likely retirement income, and taking action to prepare for retirement.)
Key Driver Analysis (KDA) found that dashboard take-up was most strongly associated with pension engagement, confidence and information-seeking behaviours, while successfully accessing the MoneyHelper Pensions Dashboard was most strongly associated with having already completed the GOV.UK One Login identity verification.
Dashboard uptake was relatively limited during the initial period of access. Around a quarter of participants (26%) successfully accessed the dashboard and viewed at least some pension information, while a further 21% attempted to access the service but did not complete the journey. Almost half (44%) did not attempt access at all.
Uptake was concentrated among participants who were already more engaged with pensions and retirement planning. Successful users were more likely to be middle-aged adults, graduates, homeowners, higher-income households, and individuals who reported greater confidence in their pension knowledge and retirement planning.
Lack of interest was not the primary barrier to use. Both users and non-users generally understood and valued the dashboard's core proposition of bringing pension information together in one place. The principal appeal was improved visibility and reassurance, with participants typically seeking confirmation of their pension position rather than support with active pension management.
The length of the journey created significant barriers to completion. The most common individual reason given for non-completion was running out of time. However, when respondents reporting at least one One Login-related reason are considered together, One Login appears to have been the most significant overall barrier, while technical issues and the complexity of the process also contributed to drop-off.
Among those who did not attempt to access the dashboard, barriers were mainly practical rather than attitudinal. Competing priorities and lack of time were the most common reasons for non-use, while some participants felt they already knew enough about their pensions or saw limited immediate need for the service. Privacy and security concerns played a comparatively minor role.
1.2 Early outcomes
Accessing the MoneyHelper Pensions Dashboard appears to have supported greater pension engagement, confidence and awareness . While the dashboard rarely prompted immediate major financial decisions, it frequently encouraged users to reflect on their retirement planning, seek further information and take initial steps towards managing their pensions. This suggests that its primary early impact is to support engagement and informed decision-making, rather than drive immediate behavioural change.
The dashboard primarily prompted reflection, and greater engagement with pensions rather than immediate behavioural change. Accessing the MoneyHelper Pensions Dashboard appears to encourage greater engagement with pensions and retirement planning, although impacts were typically reflective rather than transformational. For many users, the dashboard provided reassurance about their pension position while also prompting further information-seeking and future planning, with signs that engagement may develop further over time.
Many users did intend to take further action in the future after using the dashboard. Around 57% stated that they planned to undertake at least one further action as a result of accessing the dashboard. These actions were commonly reflective activities such as think more about retirement planning and review pension information but also included more direct actions such as updating contact details, increasing pension contributions or exploring pension consolidation. However, qualitative evidence suggests these intentions often represented the early stages of engagement rather than firm plans, indicating that the dashboard's influence may emerge gradually over time.
The dashboard appears to have prompted follow-up when users identified issues with their pensions. While only a minority of users encountered pensions requiring action, those who did generally intended to address them. However, more than a quarter were unclear about what steps they needed to take, highlighting an opportunity for additional clarification of content and signposting to support to help users translate awareness into action. (“Pensions requiring action” is terminology used on the dashboard. It generally refers to possible pension matches that a provider has been unable to confirm using its matching criteria and for which further information is needed from the user. It may also include other circumstances in which pension information cannot be displayed. It is distinct from a confirmed pension match for which a manual valuation is required.)
1.3 User experience
The dashboard generally delivered a positive user experience, with users valuing its ability to bring pension information together in one place and provide a clearer overview of their retirement savings. While the main benefit was improved visibility and confidence rather than the discovery of previously unknown pensions, concerns about perceived missing pensions, incomplete results and the recency of information remained important sources of dissatisfaction.
The dashboard delivered a positive first experience for most users. Three quarters (75%) were satisfied with their experience overall, while only 10% were dissatisfied. Positive sentiment was also reflected in future intentions, with 81% saying they would be likely to use the dashboard again and 73% had either already recommended or were likely to recommend it to friends or family. Qualitative feedback suggests satisfaction was driven primarily by the dashboard's clear presentation, straightforward navigation and ability to bring pension information together in a single location.
Users were particularly positive about the usability and accessibility of the service. Satisfaction was highest for understanding the information presented (81%), ease of accessing and completing the process (78%), and the time taken for pension values to appear (75%). Many participants described the dashboard as simple to navigate and valued being able to view information from multiple pension providers in one place, helping them gain a clearer overview of their retirement savings.
The dashboard generally met users' information needs and improved understanding of their pension arrangements. 7 in 10 users (70%) said they were able to find the information they were looking for, while 69% agreed that the dashboard helped them understand where their pensions were held. Users often reported that information matched their existing records, providing reassurance that their pension information was accurate and complete.
Finding lost pensions represented a notable benefit. Around one in 8 users (12%) reported discovering a lost or previously unknown pension through the dashboard. While these pensions were not always of significant value, participants often viewed the ability to confirm that no pensions had been overlooked as an important source of reassurance and peace of mind.
Pensions perceived to be missing from results remained the most significant source of frustration. Nearly one third of users (32%) reported that pensions they expected to see were absent from their results. Qualitative evidence indicated that pensions perceived to be missing, pending results and results perceived as out of date could undermine confidence in the dashboard, even among users who were otherwise satisfied with their experience. (The research was conducted before the connection deadline, while pension providers and schemes were still connecting to the dashboards ecosystem. Some pensions perceived to be missing may therefore not have been connected at the time of the research. In other cases, users may not have recognised a pension under its scheme name, may have misunderstood the information presented or may have expected to see a pension that was outside the dashboard’s scope.)
Back to top2. Research background and methodology
2.1 Background
Pensions dashboards will be a new UK-wide digital service that will allow individuals to securely access information about all their pensions online (via computer, tablet or mobile device) in one place at any time of choosing. (Some pensions are not in scope for pensions dashboards and therefore may not be displayed, including pensions already in payment, State Pension entitlements for those above State Pension age, occupational schemes with fewer than 100 members, non-UK pensions, and non-tax-approved pensions.)
Under the Money and Pensions Service (MaPS) MoneyHelper brand, the MoneyHelper Pensions Dashboard (MHPD) is designed to improve people’s understanding and engagement with their pensions to support more informed planning for retirement.
Currently MHPD is in the private beta phase of its development which involves testing and iterating the service into a launch-ready product. The user testing and research conducted as part of this study provides MaPS with an evidence base on how consumers engage with the dashboard and the extent to which it delivers its intended outcomes. These findings will help MaPS, PDP, DWP and regulators understand how consumers are likely to engage with the service as it moves towards public beta and wider availability.
2.2 Research aims and objectives
This study was designed to assess how consumers engage with the MoneyHelper Pensions Dashboard and the extent to which using the service influences pension awareness, confidence and behaviour over time.
The study explored:
- Pension engagement before dashboard use
- Dashboard reach and accessibility
- User experience of the dashboard
- Future actions after dashboard use
While this wave of research examined intended actions following dashboard use, the next wave of research will provide a more detailed assessment of longer-term behavioural outcomes.
2.3 Methodology
Quantitative approach
The findings presented are drawn from 2 waves of an online survey conducted by Ipsos’ Knowledge Panel (KP). The first wave was carried out between 25 June and 2 July 2026 and the second between 9 and 16 July 2026.
For this research, a total of 7,301 Ipsos UK Knowledge Panel members aged 18-74 were invited to participate in the baseline online survey module. The Knowledge Panel is a random probability survey panel and therefore, does not use a quota approach when conducting surveys. Instead, invited samples are stratified when conducting waves to account for any profile skews within the panel. The sample was stratified by country, age and education.
The survey was designed using a mobile-first approach to maximise accessibility and respondent engagement. This included limiting questionnaire length, avoiding complex grid questions, ensuring questions were easy to complete on a mobile device, and maintaining compatibility with screen-reader software.
Up to 3 people per household were permitted to participate. Design weights were applied to account for differing probabilities of respondent selection within households of different sizes.
The baseline survey took place between 25 June and 2 July 2026 and was open for one week. Participants were incentivised by points added to their Knowledge Panel account. In the baseline survey, we achieved 3,407 completes, an overall response rate of 46.7%.
Following the baseline survey, all participants that took part were invited to visit the MHPD using a unique link. A small number of participants (250) were sent a pilot email one day after the baseline survey closed to ensure the link process worked effectively, with the remainder (3,157) sent out 4 days later. A reminder email was sent to all baseline participants one day before the initial outcomes survey was launched inviting them to access the dashboard before completing the survey.
We recontacted all participants of the baseline survey a week after the baseline survey closed (regardless of dashboard usage) to take part in the wave 2 initial outcomes survey.
In the follow-up survey, we achieved 2,227 completes including 595 completes from those who had accessed the dashboard and viewed their pension results. A further 476 had tried to access the dashboard and failed, while 971 had not attempted access. (A further 185 respondents either did not know or preferred not to say whether they had accessed the dashboard. As their dashboard usage status could not be determined, they were not asked the detailed questions about dashboard experiences and outcomes. However, they were asked about their likelihood of using the dashboard in future.) 1,180 participants from the baseline survey did not complete the wave 2 initial outcomes survey, giving a retention rate of 65.4% from the baseline survey sample.
The initial outcomes survey was open for a week (9 to 16 July 2026), so participants typically had 3 to 13 days to access the dashboard.
2.3.1 Weighting
The responding sample was weighted to official population benchmarks specific to 18 to 74 year-olds in Great Britain, derived from recent Mid-Year Population Estimates and the Census. This ensures the weighted sample is representative of the GB 18 to 74 year-old population.
To achieve a nationally representative sample, we weighted the sample across the following key characteristics: age-by-gender, region, IMD quintiles, education, ethnicity and the number of adults in a household. For wave 2 weighting, we retained the same weights as used at baseline.
Note that due to rounding, not all percentages in reporting will always equal to 100%. Net confidence or agreement scores are calculated by subtracting those who were not confident from those who were confident to give a positive (more confident or more agreement) or negative score (less confident or more disagreement). Where differences are commented on in this report, they are statistically significant to the 95% confidence level.
2.4 Qualitative approach
To complement the survey findings, Ipsos conducted a programme of qualitative in-depth interviews (IDIs) with participants who had completed the survey to explore participants' experiences, motivations and behaviours in greater depth. The qualitative research was designed to explore the reasons behind observed behavioural outcomes and provide contextual insight into how participants engaged with the MHPD, including barriers to access, perceptions of the service, and any resulting changes in knowledge, confidence and behaviour.
A total of 60 qualitative interviews were conducted between July and September 2026. Interviews lasted up to 45 minutes and were carried out via a mixture of telephone and online interviewing. Participants were recruited from the survey sample using quota controls developed from Wave 1 and Wave 2 survey responses, ensuring coverage across key demographic groups and attitudinal segments.
The sample included both participants who had successfully accessed the MHPD and viewed some or all of their pensions (n=35) and those who had attempted to access the dashboard but had not completed the process (n=25). Quotas were also applied across characteristics including age, gender, nation, deprivation level, pension engagement and pension planning segment to ensure a broad range of perspectives were captured.
A semi-structured discussion guide was used to explore participants' existing attitudes towards pensions and retirement planning, experiences of accessing the MHPD, interactions with GOV.UK One Login and identity verification, perceived benefits and challenges of the dashboard, knowledge and confidence gains, actions taken following use of the dashboard, and motivations and barriers among those who did not successfully complete the access journey. All interviews were conducted with informed consent, recorded for analysis purposes, and findings have been reported anonymously.
Back to top3. The pension engagement landscape before dashboard use
This section explores consumers' financial and pension circumstances before using the dashboard, including their levels of pensions understanding, confidence, planning and engagement. By examining existing knowledge gaps, behaviours and barriers to engagement, it establishes the baseline context against which the dashboard's impact can be assessed and highlights areas where dashboards may improve awareness, understanding and retirement planning.
3.1 Financial resilience
Before accessing the MHPD, many participants at baseline were balancing pension planning against wider financial pressures. While around half (47%) reported keeping up with all bills and credit commitments without difficulty, a similar proportion (46%) were experiencing some level of financial strain, including struggling from time to time (28%), constantly struggling (12%), falling behind with bills (4%), or experiencing more serious financial difficulties (2%).
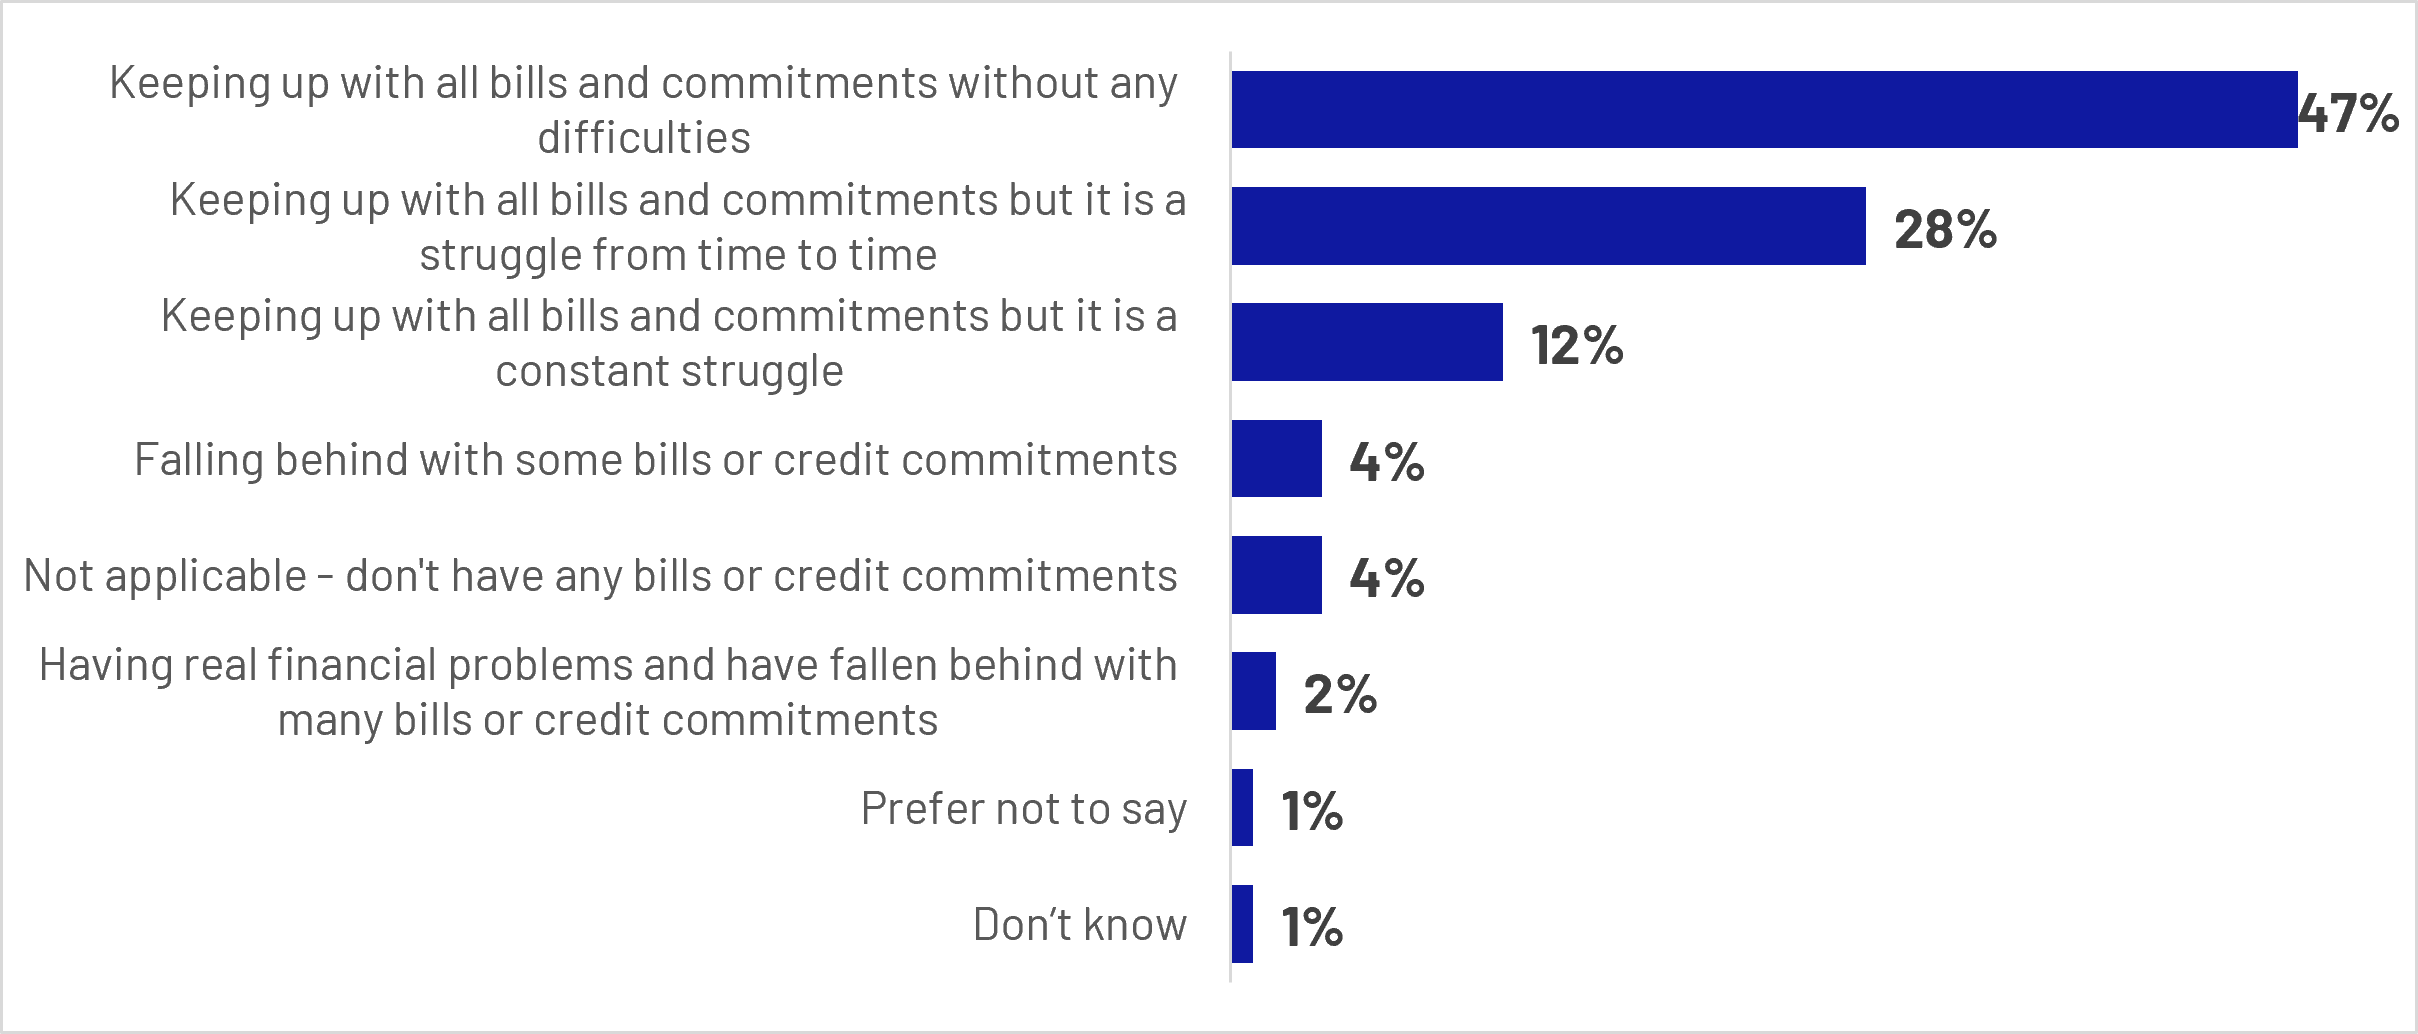
Figure 3.1: Q1: How well are you keeping up with bills and credit commitments at the moment?
Base: All Wave 1 respondents (n=3407 unweighted)
Bar chart showing how respondents are keeping up with bills and commitments:
- Keeping up with all bills and commitments without any difficulties: 47%
- Keeping up with all bills and commitments but it is a struggle from time to time: 28%
- Keeping up with all bills and commitments but it is a constant struggle: 12%
- Falling behind with some bills or credit commitments: 4%
- Not applicable – don't have any bills or credit commitments: 4%
- Having real financial problems and have fallen behind with many bills or credit commitments: 2%
- Prefer not to say: 1%
- Don’t know: 1%
Financial strain was not evenly distributed across the population. Younger adults, lower-income households, renters, and those with health conditions were more likely than average to report difficulties keeping up with bills and commitments. In contrast, homeowners, higher-income households, and older adults were more likely to report financial stability.
These findings provide important context for understanding pension engagement. For a substantial minority of people, immediate financial concerns may compete with longer-term retirement planning, potentially limiting the time, attention and resources available to engage with pensions.
The qualitative findings reinforce this picture. Participants frequently described pension planning as competing with more immediate financial priorities, including mortgage payments, childcare and family-related costs, and the rising cost of everyday living. Where financial resources were constrained, retirement planning was typically deprioritised in favour of managing current needs. Even among those who were not experiencing significant financial strain, uncertainty about future living costs sometimes created reluctance to commit additional money to pensions, reflecting concerns about locking away funds that might be needed in the shorter term.
“I'd be a bit wary with putting it [money] in a pension rather than just keeping it handy, just because I might need it for another thing. So, it still feels a little bit of a nervous thing putting it away because you're locking it away for so long.”
Male participant, Aged 45-54, Accessed the MHPD, Confident and Proactive Segment
3.2 Pension understanding
Levels of pension understanding were mixed. Excluding those already retired, around half of participants (49%) agreed that they understood enough about pensions to make decisions about saving for retirement, while 30% disagreed. This suggests that pension understanding remains uneven across the population, with many consumers still lacking the confidence needed to make informed decisions about their retirement savings.
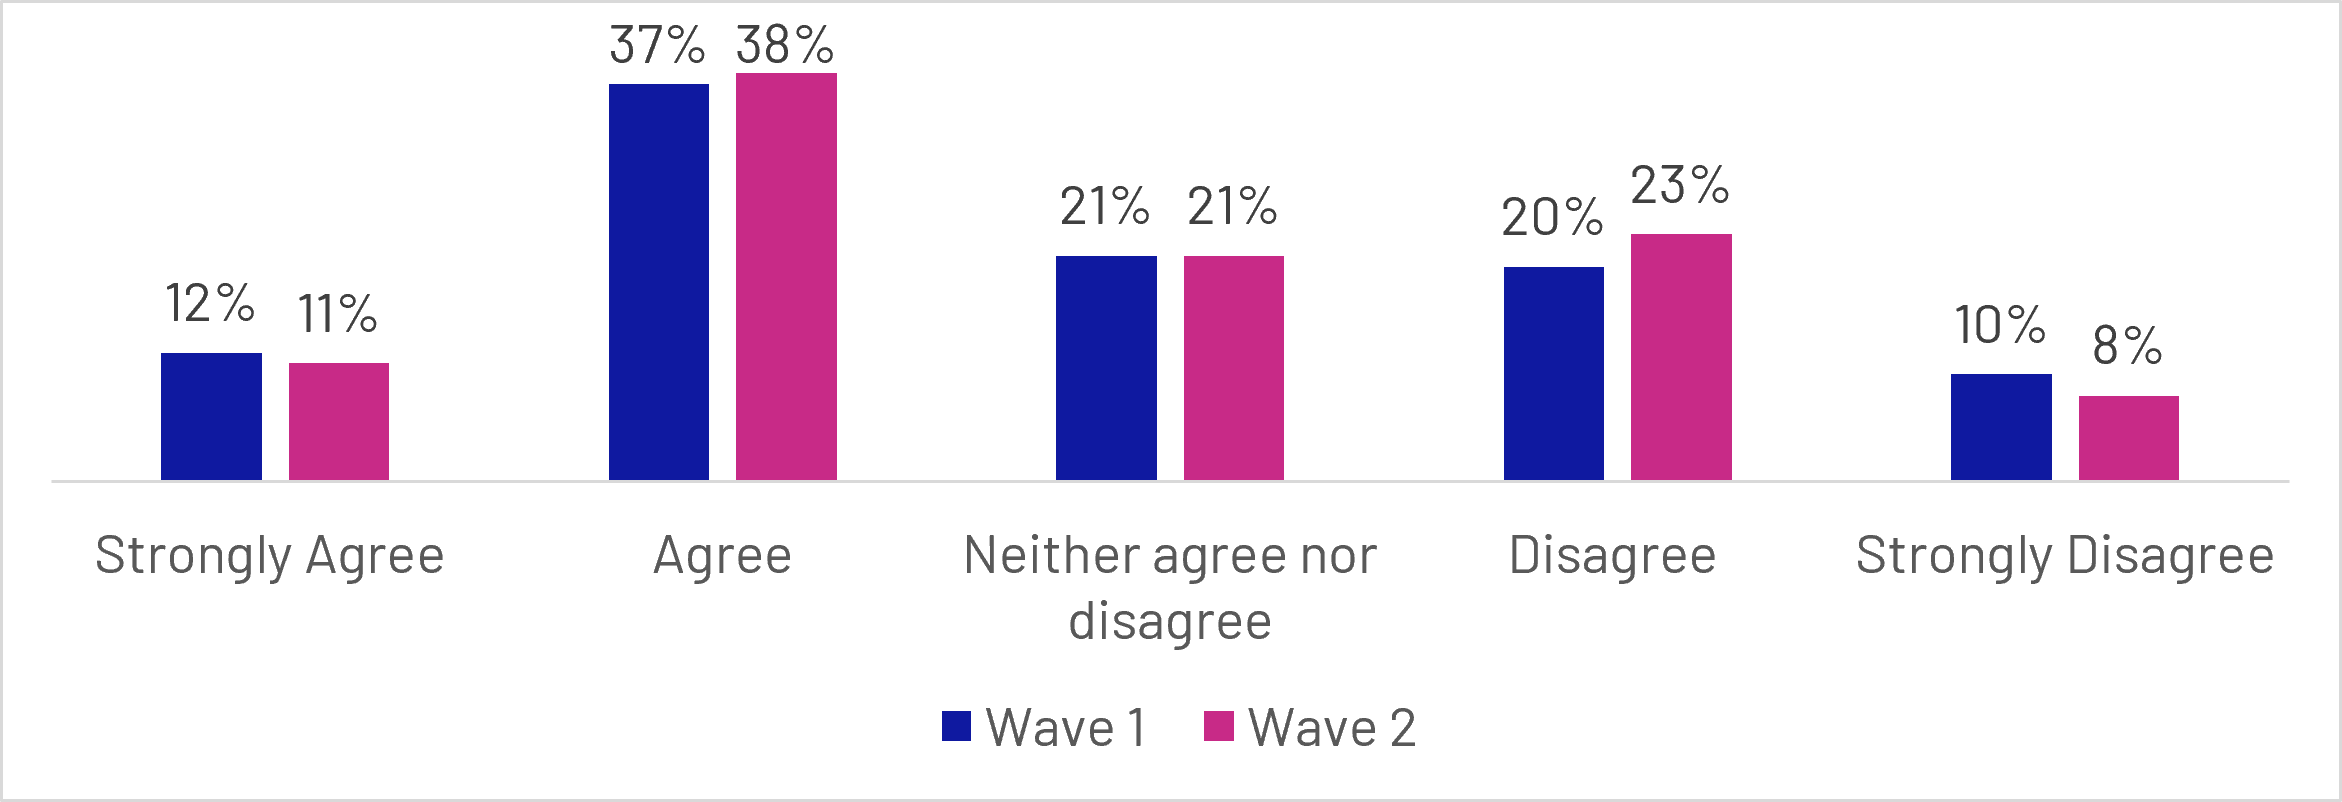
Figure 3.2: Q2: To what extent do you agree or disagree, if at all with: I understand enough about pensions to make decisions about saving for retirement?
Base: All not retired or answering don’t know or prefer not to say (n=4871 unweighted)
Grouped bar chart comparing Wave 1 and Wave 2 responses:
- Strongly agree: Wave 1 (12%), Wave 2 (11%)
- Agree: Wave 1 (37%), Wave 2 (38%)
- Neither agree nor disagree: Wave 1 (21%), Wave 2 (21%)
- Disagree: Wave 1 (20%), Wave 2 (23%)
- Strongly disagree: Wave 1 (10%), Wave 2 (8%)
Understanding was strongly linked to socioeconomic status. Men (57%), graduates (56%), homeowners (54%) and higher-income households (£100,000 and above) (66%) were more likely to report understanding enough about pensions to make saving decisions, while lower-income households (up to £25,999) (36%) and non-graduates (45%) reported lower levels of understanding.
Alongside these knowledge gaps, many participants continued to perceive pensions as complex. Just over half (51%) agreed that they found pensions confusing, more than double the proportion who disagreed (25%). Similarly, 42% agreed that they did not know where to start when planning for retirement, compared with 36% who disagreed. These findings point to a substantial proportion of the population who struggle not only with understanding pensions, but also with navigating the broader retirement planning process.
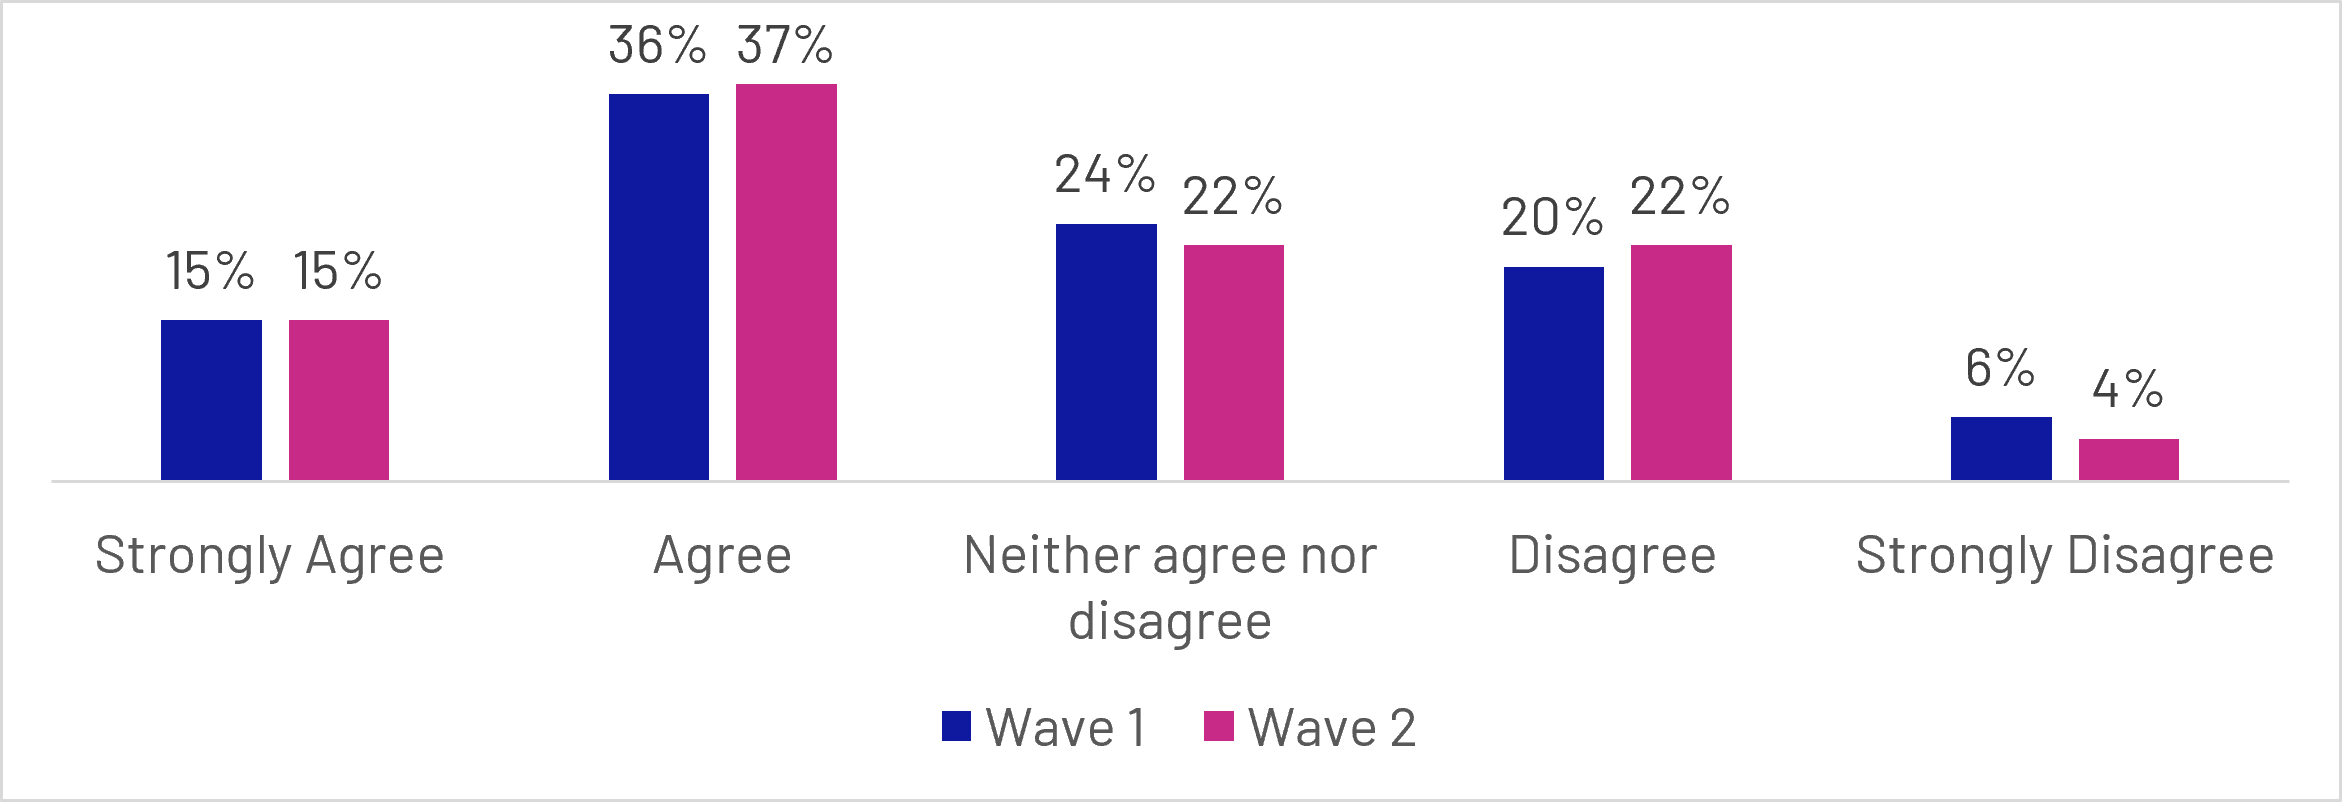
Figure 3.3: Q14: To what extent do you agree or disagree, if at all, with the following statements? - I find pensions confusing
Base: All not retired or answering don’t know or prefer not to say (n=4675 unweighted)
- Strongly agree: Wave 1 (15%), Wave 2 (15%)
- Agree: Wave 1 (36%), Wave 2 (37%)
- Neither agree nor disagree: Wave 1 (24%), Wave 2 (22%)
- Disagree: Wave 1 (20%), Wave 2 (22%)
- Strongly disagree: Wave 1 (6%), Wave 2 (4%)
Broader measures of pension confidence reinforced this picture. Participants were most confident about practical aspects of pension saving, such as knowing how to increase contributions and understanding their current contribution levels. Confidence was considerably lower for more complex retirement decisions, including pension consolidation, assessing whether contributions would be sufficient, understanding pension features, and making decisions about accessing pension savings. Across these topics, more participants reported being unconfident than confident.
The qualitative findings provide further context to these patterns. Participants did tend to have some understanding of their pensions, but this was often limited beyond the basic purpose of a pension, with many able to describe why pensions are important and how contributions are made, but less confident when discussing more complex topics. Areas of uncertainty commonly included how much income pensions would provide in retirement, how different pension pots fitted together, taxation, investment choices, and the implications of different withdrawal options. Participants frequently described pensions as confusing or difficult to understand, particularly when attempting to understand future outcomes rather than current contributions. Many reported struggling because information was spread across providers and pension pots, making it difficult to form a complete picture. As a result, some felt insufficiently informed to make active decisions about their pension arrangements, often relying on default workplace pension settings or postponing engagement until retirement felt closer.
“The whole pension thing is a complete minefield and at the moment doesn't make any sense to me […] I don't think anyone's ever really explained it in terms that I understand. It is very confusing.”
Female participant, Aged 55-64, MHPD User, Confused and Too Busy Segment
Knowledge of specific pension concepts did not necessarily translate into confidence. Participants could understand the available options but remained unsure about which choice was right for them, particularly when decisions involved tax, withdrawals or long-term investment outcomes. Confidence was undermined by both the unpredictability of future circumstances and the perception that pensions were complex and easy to get wrong, with the volume of available information sometimes increasing, rather than reducing, uncertainty.
“Am I doing enough now that will see me right for the future? Although I've got all this control in the short term, ultimately, what will the picture look like in 30 years?”
Male participant, Aged 25-34+, MHPD User, Confident and Proactive Segment
Participants primarily felt that improving understanding would require less technical information and more practical guidance. They wanted pensions explained in plain language, clearer illustrations of what current savings might mean for future retirement income, simple explanations of taxation and withdrawal options, and a consolidated view of all pension pots.
“For me, probably written information would be helpful. Perhaps with real examples of the impact different decisions or choices on drawing down your pension from the pension pot.”
Female participant, Aged 55-64, MHPD User, Confused and Concerned Segment
3.3 Planning and engagement
Most participants reported having one or 2 pensions (62%), while 18% had 3 or more. However, 14% of participants said that they did not have any pensions, including almost half (45%) of 18 to 24 year-olds (although 75% of this age group were not yet in full-time employment), and around a third of those renting from the council or a housing association (35%) or those with no formal qualifications (30%).
Despite relatively modest levels of understanding, retirement saving was widely recognised as important. Excluding those already retired, just over half of participants (52%) said planning their savings for retirement was a high or top priority.
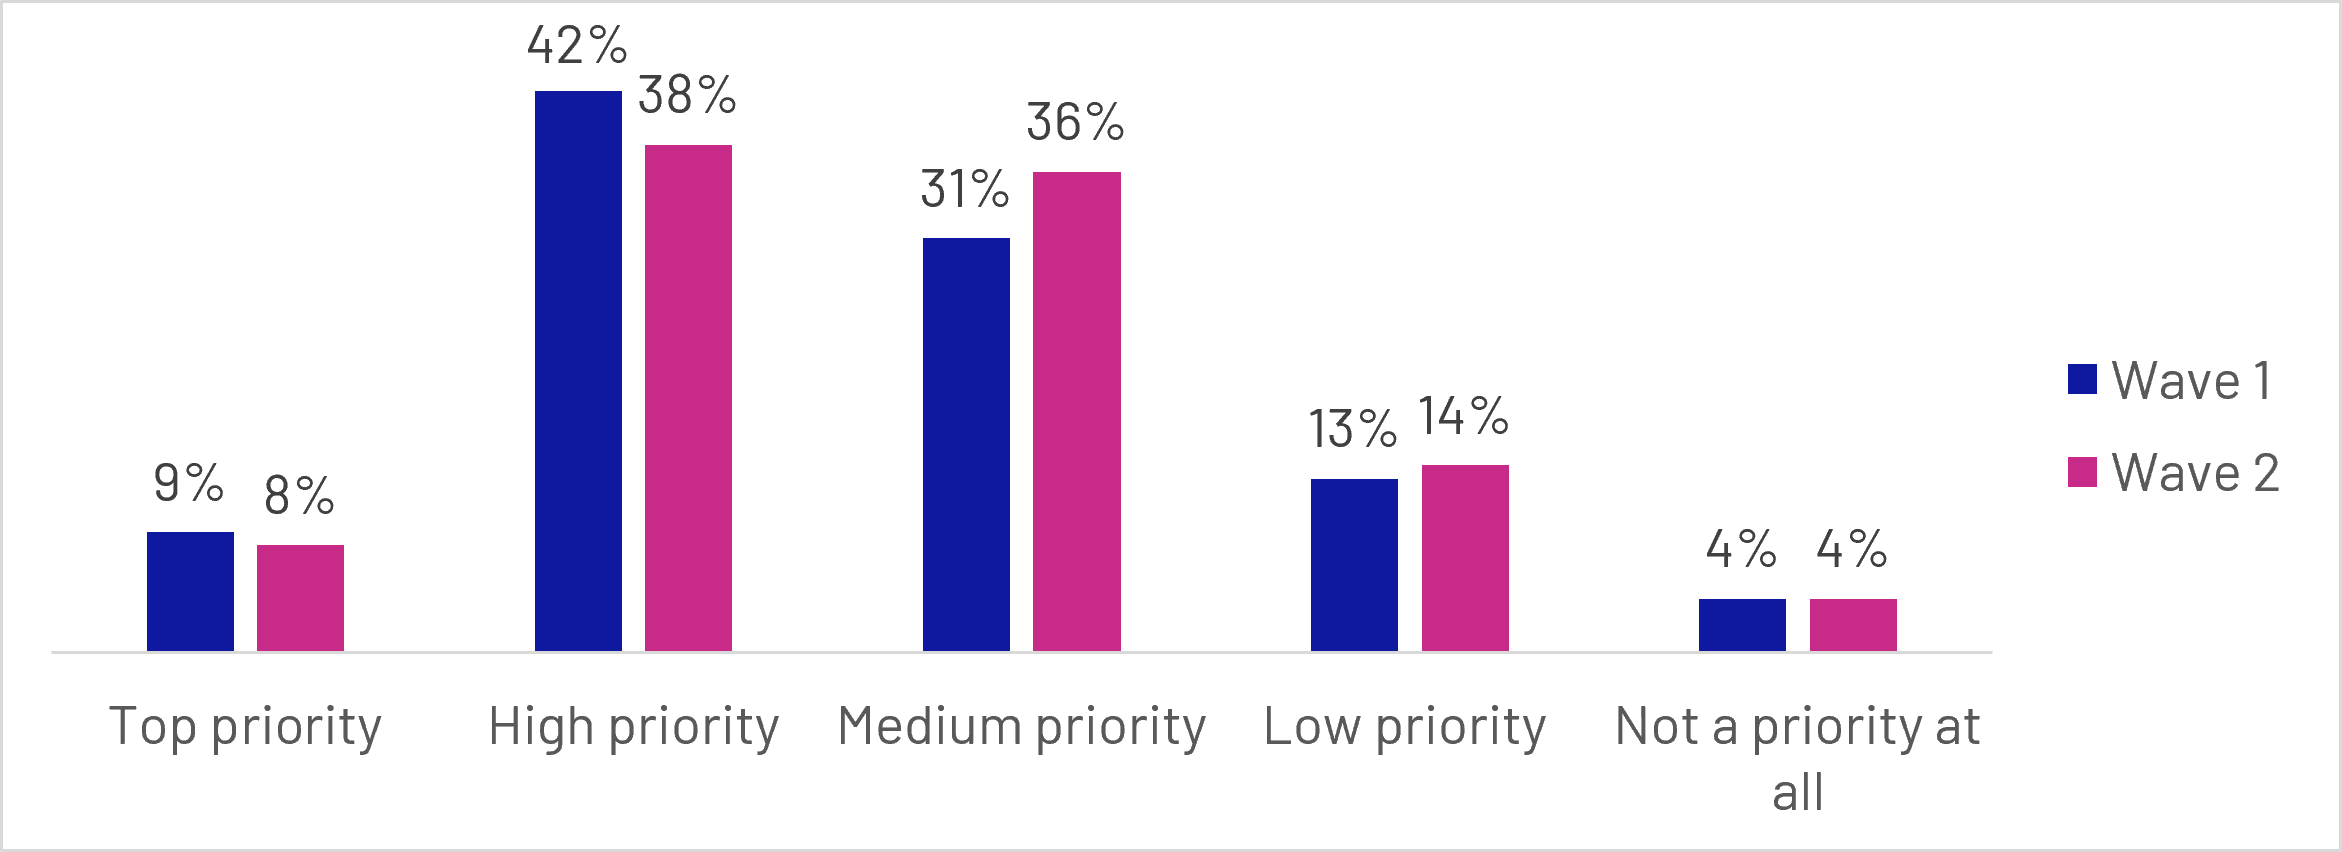
Figure 3.4: Q8: How much priority, if at all, do you think it is to plan your savings for retirement?
Base: All not retired or answering don’t know or prefer not to say (n=4890 unweighted)
Grouped bar chart comparing Wave 1 and Wave 2 responses:
- Top priority: Wave 1 (9%), Wave 2 (8%)
- High priority: Wave 1 (42%), Wave 2 (38%)
- Medium priority: Wave 1 (31%), Wave 2 (36%)
- Low priority: Wave 1 (13%), Wave 2 (14%)
- Not a priority at all: Wave 1 (4%), Wave 2 (4%)
However, this sense of importance did not always translate into active planning behaviour. Only 28% agreed that they had given retirement planning a great deal of thought, while half (50%) disagreed.
Similarly, 54% reported having either a clear plan (18%) or rough plan (36%) for their retirement finances, leaving 43% with little or no plan at all. Planning levels increased substantially with age, with those approaching or in retirement much more likely to report having a clear plan than younger adults. These findings suggest that while retirement planning is established for some consumers, a sizeable minority have yet to develop a meaningful plan for their later-life finances. While many participants recognised the importance of preparing for retirement, fewer appeared to be actively engaging with the steps needed to do so.
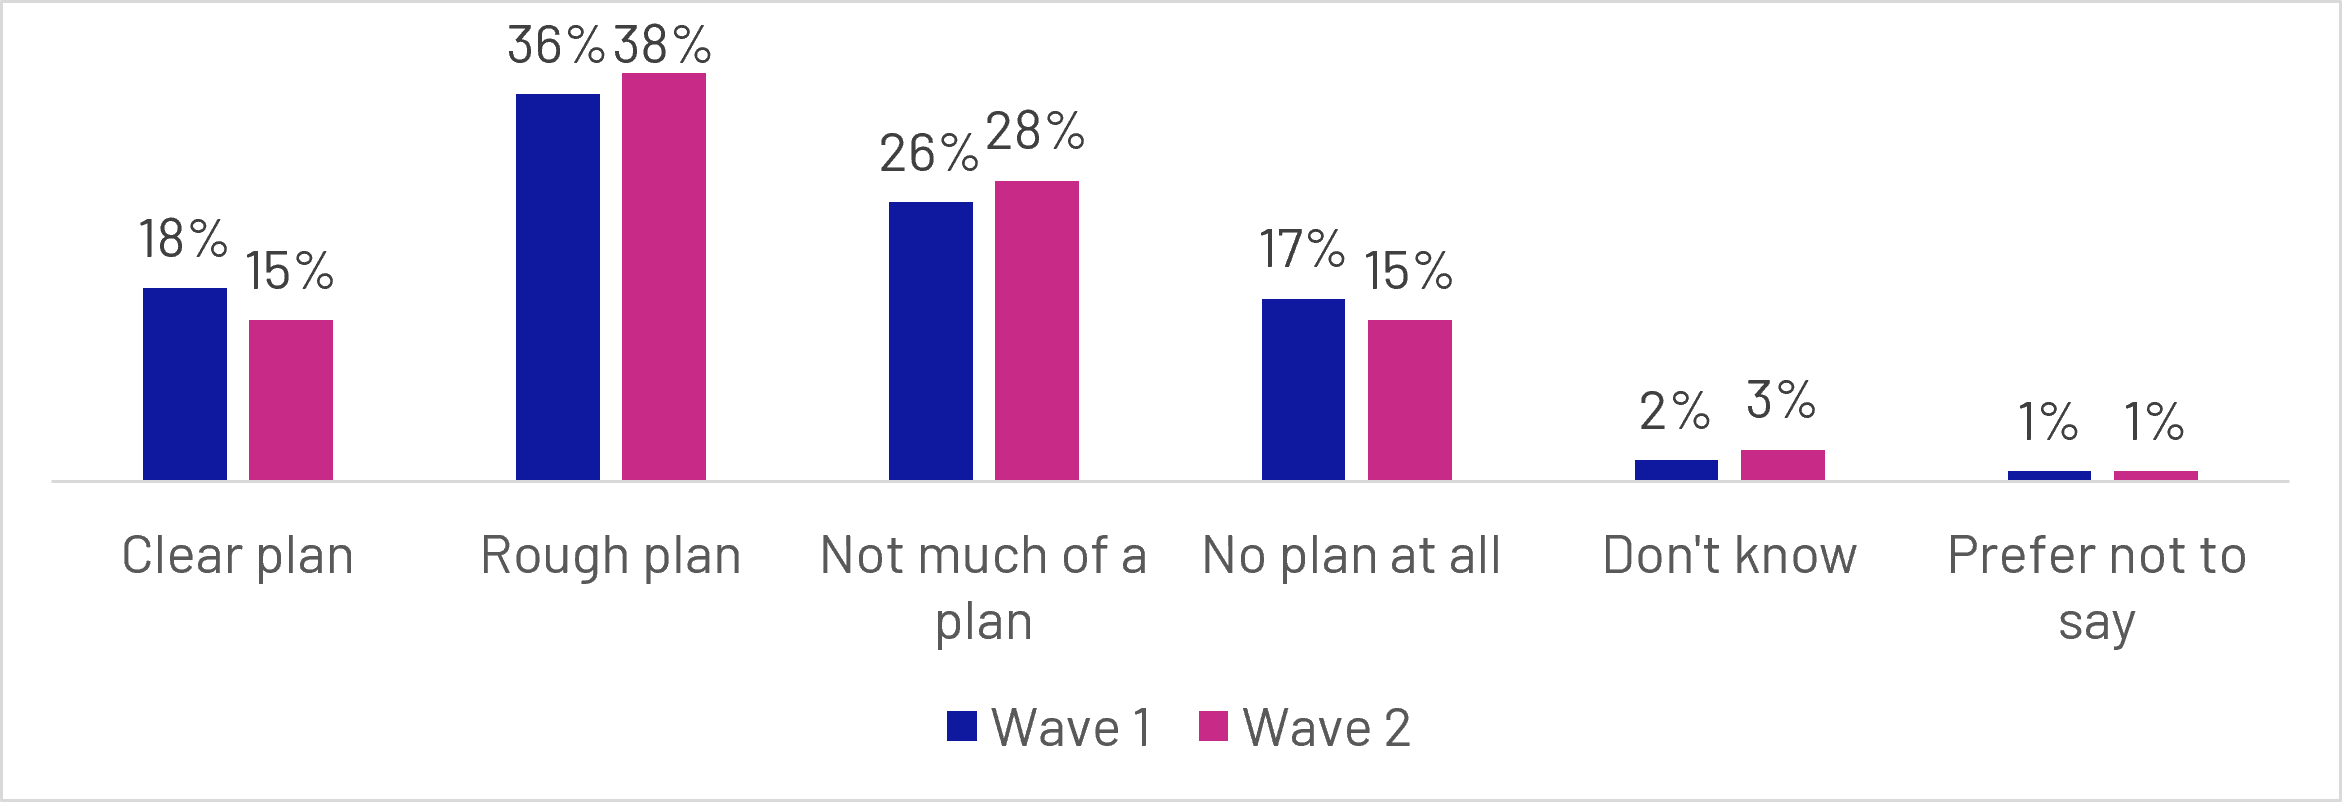
Figure 3.5: Q3: How much of a plan do you/did you have for your finances in retirement?
Base: All respondents (n=5634 unweighted)
Grouped bar chart comparing Wave 1 and Wave 2 responses:
- Clear plan: Wave 1 (18%), Wave 2 (15%)
- Rough plan: Wave 1 (36%), Wave 2 (38%)
- Not much of a plan: Wave 1 (26%), Wave 2 (28%)
- No plan at all: Wave 1 (17%), Wave 2 (15%)
- Don't know: Wave 1 (2%), Wave 2 (3%)
- Prefer not to say: Wave 1 (1%), Wave 2 (1%)
Pension engagement over the previous 12 months was also relatively limited. More than a third of participants (35%) had not undertaken any of the pension-related activities measured in the survey. Among those who had engaged, activity was more likely to involve reviewing existing arrangements, such as reading annual statements (26%) or logging into online pension accounts (24%), rather than making substantive changes to pension saving or retirement plans.
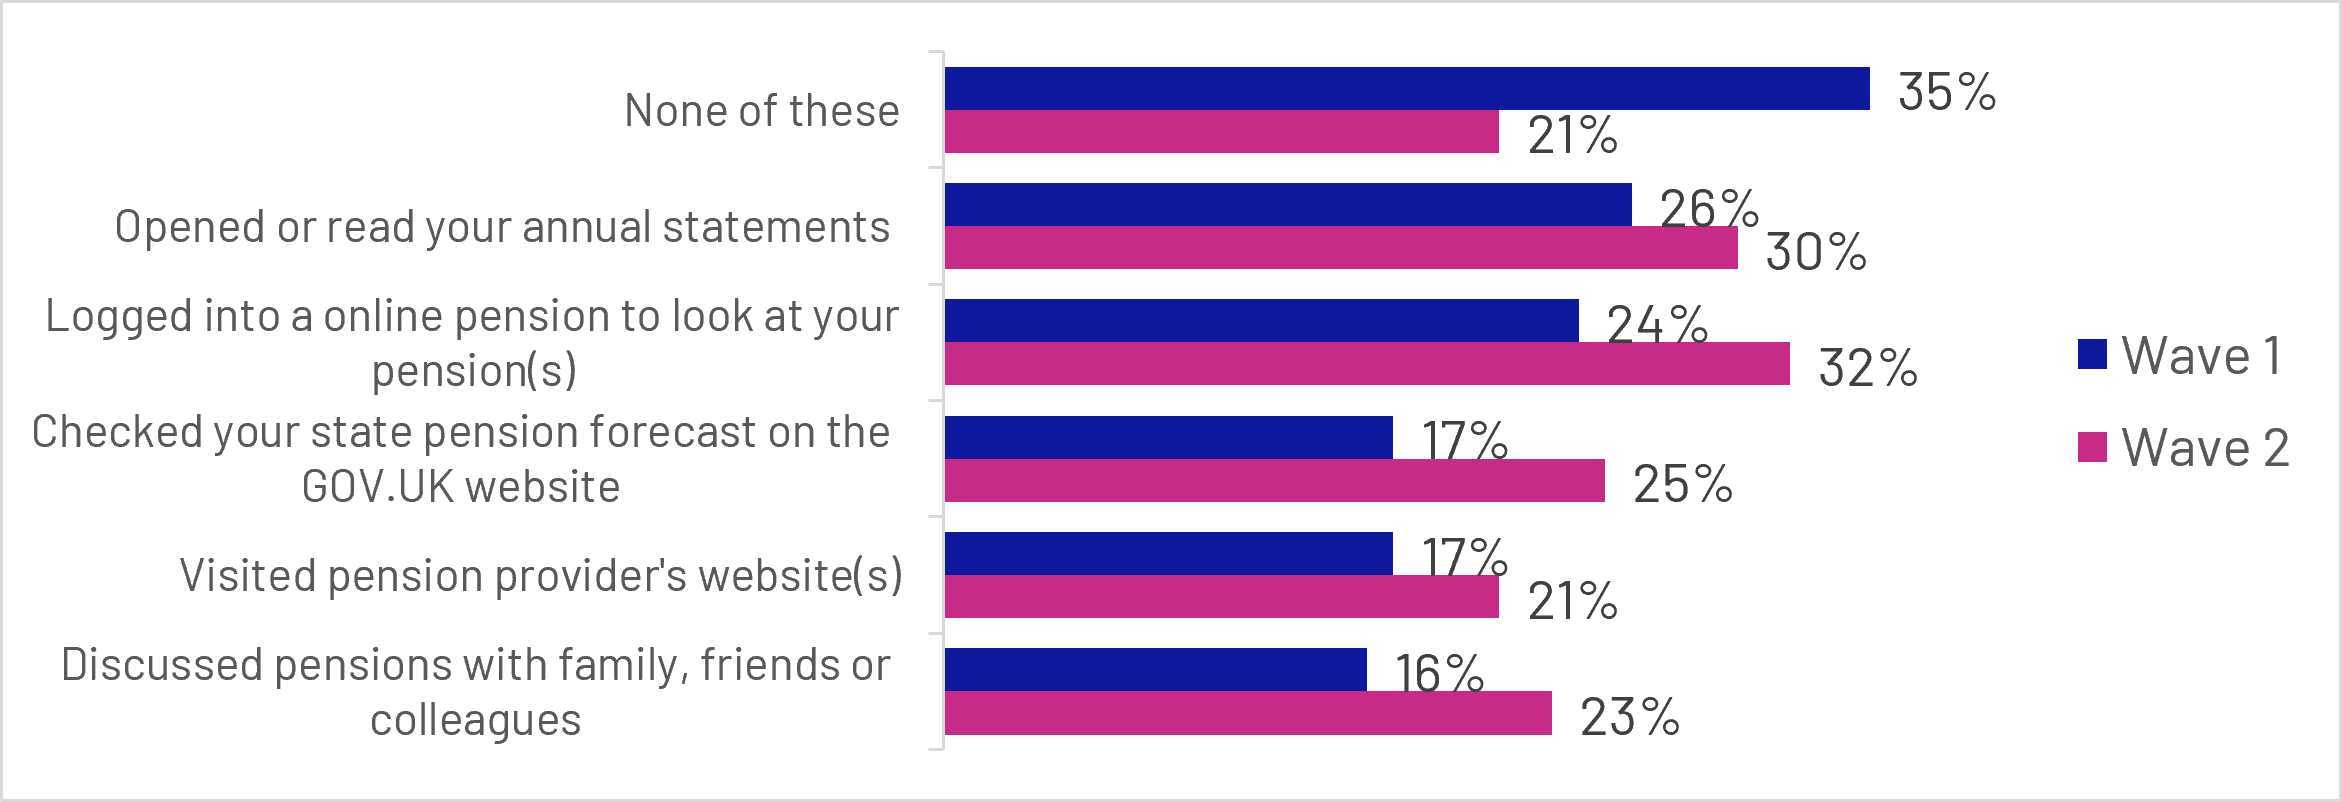
Figure 3.6: Q13: In the last 12 months, which, if any, of these pension-related actions have you taken? (top 5 actions)
Base: All respondents (n=5634 unweighted)
Grouped bar chart comparing Wave 1 and Wave 2 responses:
- None of these: Wave 1 (35%), Wave 2 (21%)
- Opened or read your annual statements: Wave 1 (26%), Wave 2 (30%)
- Logged into a online pension to look at your pension(s): Wave 1 (24%), Wave 2 (32%)
- Checked your state pension forecast on the GOV.UK website: Wave 1 (17%), Wave 2 (25%)
- Visited pension provider's website(s): Wave 1 (17%), Wave 2 (21%)
- Discussed pensions with family, friends or colleagues: Wave 1 (16%), Wave 2 (23%)
Wave 2 respondents were significantly more likely to have undertaken at least one action than Wave 1 respondents, with the proportion of those who had taken no action falling from 35% to 21% between the 2 waves. This was broadly consistent across actions, with Wave 2 respondents being significantly more likely to report all of the 5 most common actions. The increase appears to reflect genuine behaviour change between waves rather than selective participation. Around 36% of respondents who went on to complete Wave 2 reported taking no action at Wave 1, suggesting that the increase was driven by respondents taking action after the first survey, rather than those who had already taken action being more likely to participate in Wave 2.
Nearly one in 6 Wave 1 respondents (17%) believed they may have a lost pension, with a further 13% not sure whether they had lost a pension or not. Those more likely to have reported that they have a lost pension included people who are falling behind financially (32%), 35–44 year-olds (25%), and those who are either ‘Disengaged and Inactive’ (28%) or ‘Confused and Too Busy’ (26%).
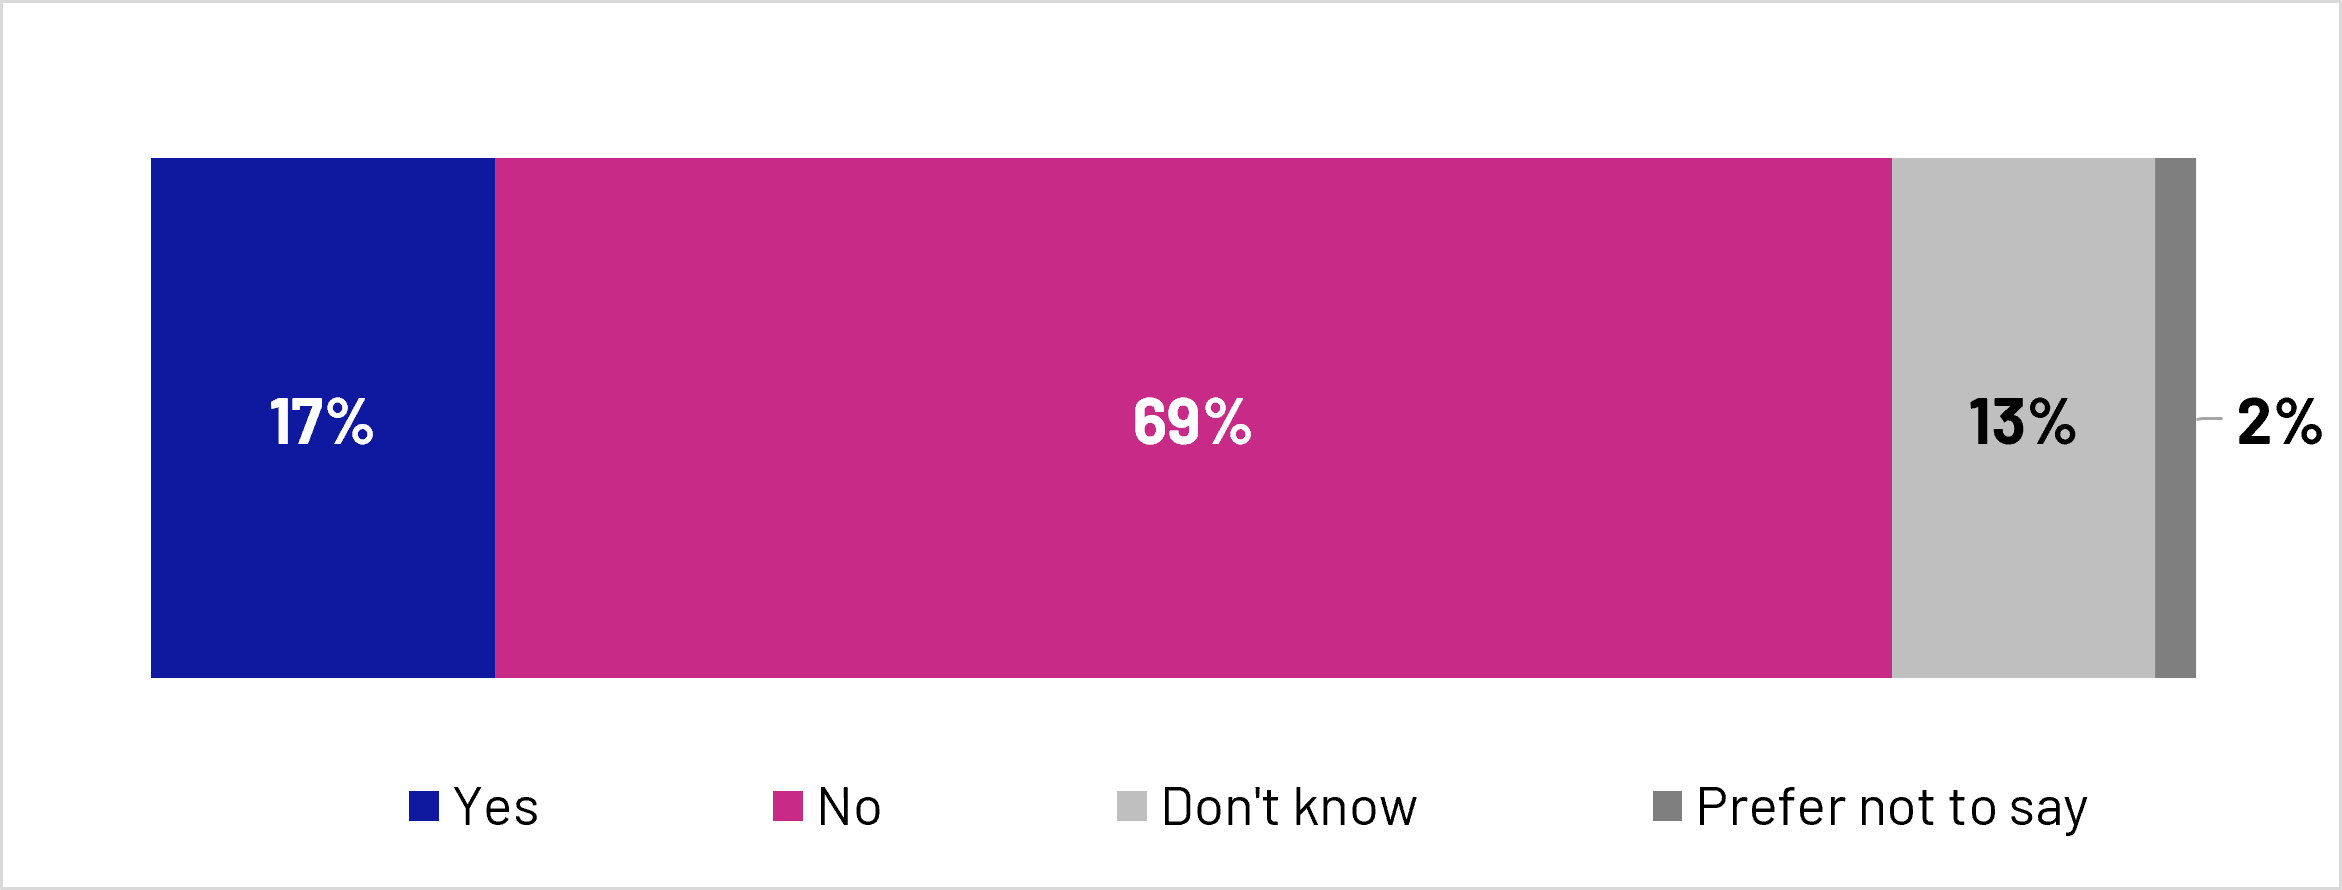
Figure 3.7: Q5: Thinking about pensions from previous jobs or any personal pensions you set up yourself, is there any pension you think you have but don't currently have the details for?
Base: All Wave 1 respondents (n=5634 unweighted)
Stacked bar chart showing responses:
- Yes: 17%
- No: 69%
- Don't know: 13%
- Prefer not to say: 2%
Taken together, the findings suggest a clear engagement gap. While many people recognise the importance of retirement saving, substantial proportions lack confidence in their understanding of pensions, find pensions confusing, or have not yet translated concern about retirement into active planning and engagement. This highlights the potential opportunity for pensions dashboards to support greater awareness, understanding and engagement with retirement planning.
The qualitative research reinforces the existence of an engagement gap between recognising the value of pensions and taking action. While participants widely acknowledged pensions as important, their understanding of pensions was often limited beyond their basic purpose, with uncertainty around issues such as retirement income, withdrawal options, taxation, investment choices and how multiple pension pots fit together. This limited engagement was reinforced by a tendency to view pensions as something that could largely be left to automatic workplace contributions, leading some to defer engagement and planning.
"I've not really sat down and projected how much I think I'll be getting. I kind of just trust that the work pensions are being paid into. I suppose I trust that it will be enough."
Female participant, Aged 35-44, MHPD User, Confident and Proactive Segment
Disengagement was particularly common among those facing competing financial pressures, which shifted attention away from retirement planning and towards more immediate concerns. These pressures took a variety of forms, but most commonly included mortgages, childcare or family-related costs, and the challenge of meeting everyday expenses on a limited income. Even where participants were not experiencing acute financial strain, uncertainty about future costs, particularly the rising cost of living, could make them reluctant to ‘lock’ money away in a pension that they feared they might need to access for more immediate priorities.
“I guess there is it is a bit of uncertainty about your own future and what might happen in your life and whether you've got a mortgage [...] mortgage rates have gone up so it’s harder to justify putting money in pension if you need it now."
Male participant, Aged 45-54, MHPD User, Confident and Proactive
Participants often faced emotional barriers that reduced engagement with pension planning. Pensions were frequently described as "complicated", a "minefield" or overwhelming. This uncertainty often created anxiety and a sense of limited control, particularly when participants felt unable to predict future costs or understand the decisions available to them. For some, avoidance became a coping strategy, with pension planning postponed until retirement felt closer. In contrast, participants who had clearer information, confidence in their pension arrangements, or professional support were more likely to feel reassured, optimistic and in control of their retirement prospects.
"I suppose I feel a bit anxious about it, really. I've probably got a knot in my stomach thinking, well, I need to strike this balance, but I need to be prepared... you don't know what's around the corner."
Female participant, Aged 35-44, MHPD User, Confident and Proactive
4. Dashboard reach and accessibility
This section examines who accessed the MHPD, who did not, and the barriers encountered throughout the access journey. It explores levels of dashboard uptake, the characteristics associated with successful access, and the reasons some participants either chose not to engage with the dashboard or were unable to complete the process. This provides important context for understanding the reach of the dashboard and the factors influencing user engagement.
4.1 Key quantitative findings
Within the follow-up survey period, around a quarter of participants (26%) successfully accessed the dashboard and viewed some or all of their pensions. A further 21% attempted to access the dashboard but did not complete the process, while 44% did not attempt to access the dashboard at all. The remaining participants either did not know or preferred not to say whether they had attempted access. These findings indicate that, while a substantial minority engaged with the dashboard during the initial test period, a larger proportion either did not begin the process or were unable to complete it successfully.
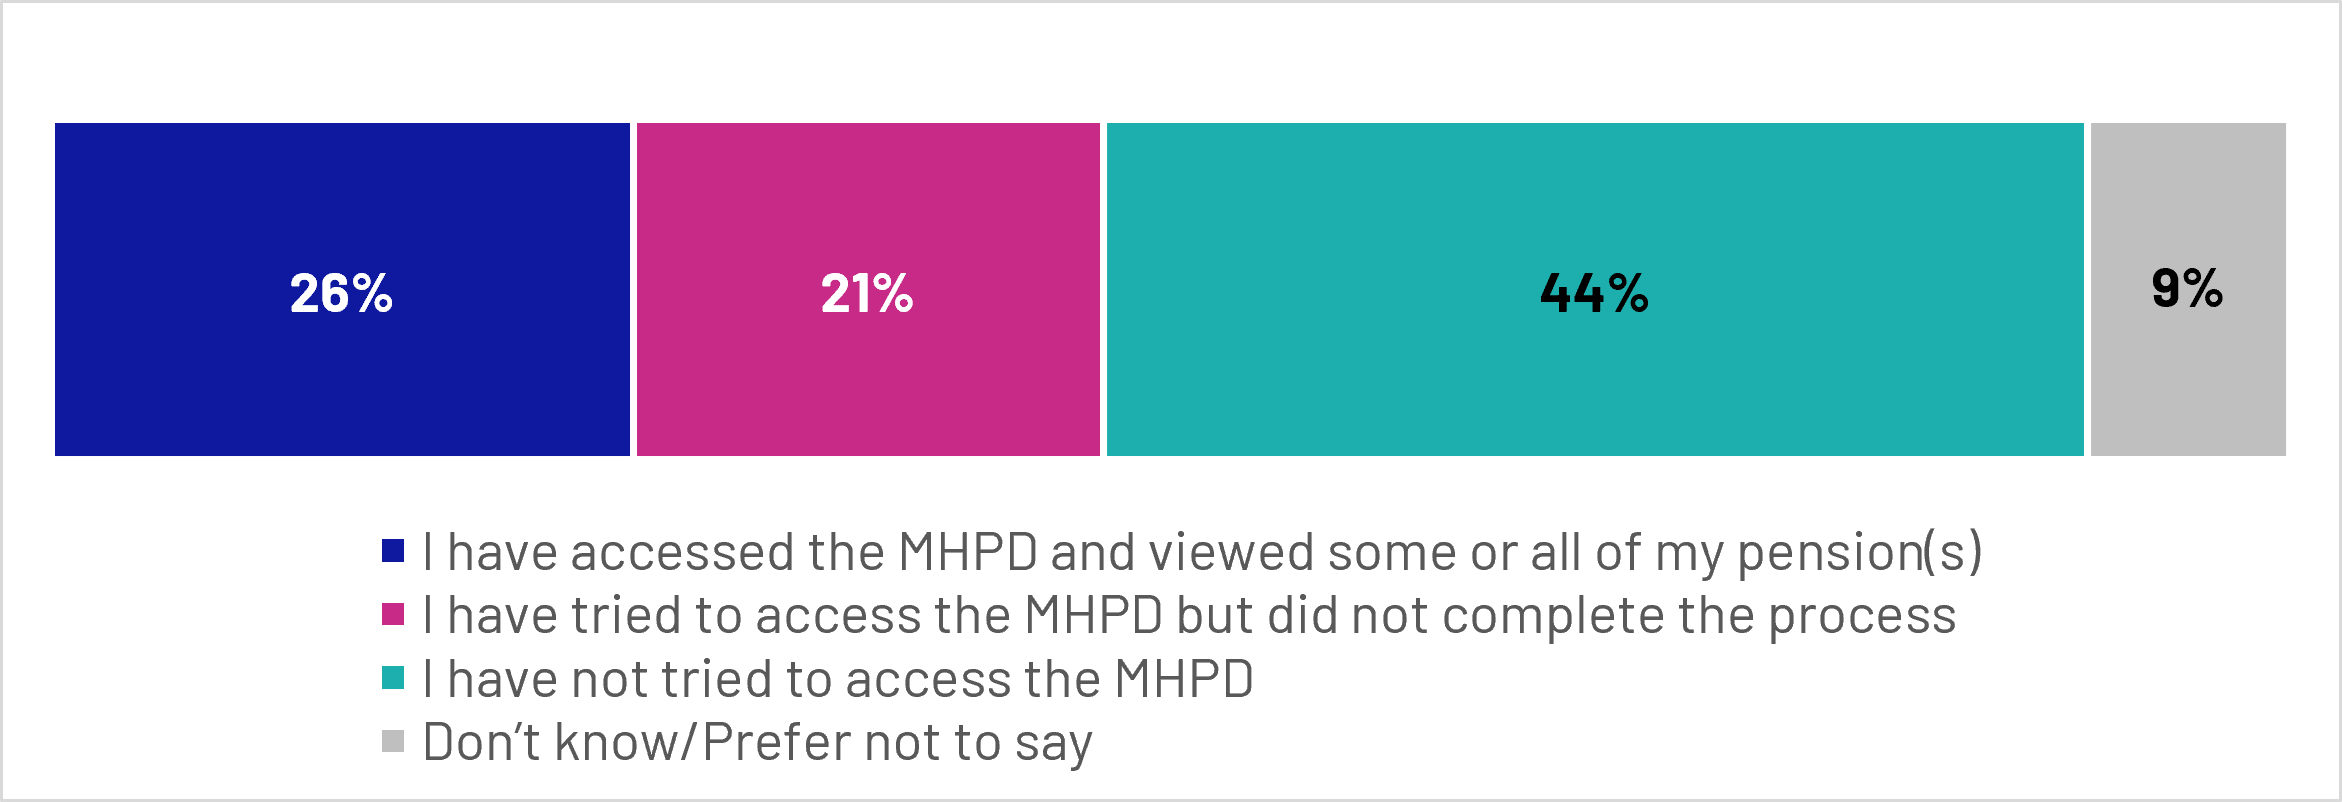
Figure 4.1: Q20: Since the last survey, which of the following best describes your experience with the MHPD?
Base: All Wave 2 respondents (n=2227 unweighted)
Stacked bar chart showing responses:
- I have accessed the MHPD and viewed some or all of my pension(s): 26%
- I have tried to access the MHPD but did not complete the process: 21%
- I have not tried to access the MHPD: 44%
- Don’t know/Prefer not to say: 9%
4.2 User profile
The profile of dashboard users suggests that uptake was strongest among groups who were already more engaged with their pensions and retirement planning. Successful users were significantly more likely to be aged 35-64, particularly those aged 45-54 (33%), 55-64 (31%) and 35-44 (30%), compared with just 11% of 18-24 year-olds. Dashboard access was also higher among graduates (34%), homeowners (29%), and higher-income households, reaching 35% among those with annual household incomes of £100,000 or more.
Financial attitudes and behaviours were also associated with dashboard use. Those who already demonstrated stronger pension engagement were more likely to access the dashboard. Around a third (32%) of those with a clear or rough retirement plan accessed the dashboard, compared with 21% of those with little or no plan. Similarly, 33% of those who reported understanding pensions well enough to make saving decisions accessed the dashboard, compared with 22% of those who did not. Usage was particularly high among the Confident and Proactive MaPS segment, with 42% accessing the dashboard, compared with 17% of the Disengaged and Inactive segment.
Conversely, uptake was lower among groups who may have most to gain from greater pension visibility. Participants without formal qualifications, council or housing association renters, and those living in the most deprived areas were all less likely than average to access the dashboard.
4.3 Reasons for non-completion
For participants who attempted to access the dashboard but did not complete the journey, running out of time was the most common individual reason given. However, when the different reasons associated with GOV.UK One Login are considered together, One Login appears to represent the most significant barrier overall.
Successful dashboard access therefore depended at least partly on readiness to complete the GOV.UK One Login process. Over half of Wave 1 respondents (57%) had heard of One Login, while around 3 in 10 (32%) had not, with a further 10% being unsure. Around 7 in 10 of those who had heard of the service reported having an account and having proved their identity (71%).
Wave 2 respondents were substantially more likely to have heard of GOV.UK One Login (83%). This increased awareness appeared to be associated with more respondents having started the registration process, with the proportion reporting that they had created an account but not completed identity verification rising from 6% in Wave 1 to 11% in Wave 2. However, there was little evidence that this translated into greater completion of the identity verification process. Among those who had heard of One Login, the proportion reporting that they had both an account and a verified identity fell from 71% in Wave 1 to 63% in Wave 2, while the proportion reporting that they did not have an account remained broadly unchanged (16% and 18% respectively).
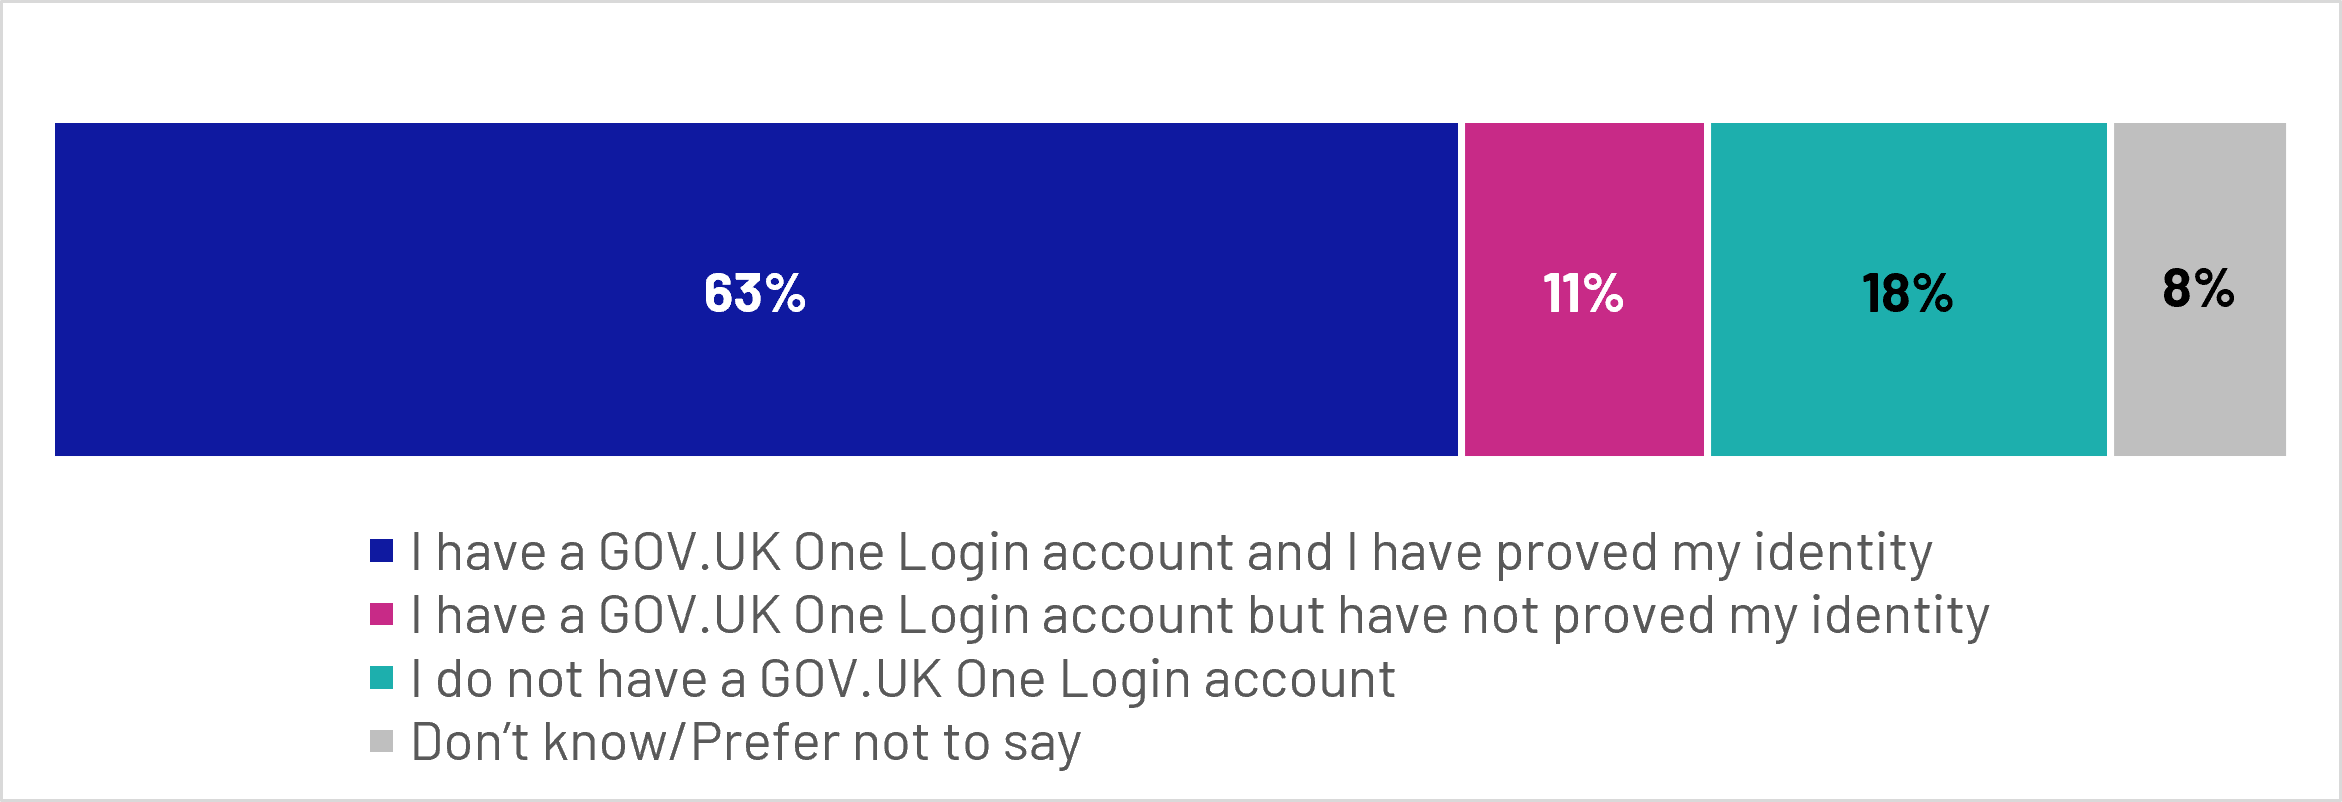
Figure 4.2: Q17: Which of the following best describes you?
Base: All Wave 2 respondents who had heard of One Login (unweighted = 1851)
Stacked bar chart showing responses:
- I have a GOV.UK One Login account and I have proved my identity: 63%
- I have a GOV.UK One Login account but have not proved my identity: 11%
- I do not have a GOV.UK One Login account: 18%
- Don’t know/Prefer not to say: 8%
These findings suggest that the identity verification element of the One Login service remains an important stage of the dashboard journey and may represent a potential barrier for some users before they can begin searching for their pensions. However, as One Login becomes more widely used across government services, more users may arrive with an existing verified identity, potentially reducing this barrier over time.
Among those who attempted to access the dashboard but did not complete the journey, the most common reasons related to time, process complexity and technical challenges. One in 5 (20%) said they ran out of time or something else came up, while 17% felt the process took too long or involved too many steps. Similar proportions reported experiencing technical problems or errors (16%) or that the service did not work properly on their device or browser (13%). (A period of planned service downtime occurred during fieldwork. As a result, some respondents may have experienced technical difficulties that were related to service availability rather than the dashboard user journey itself. The proportion reporting technical problems should therefore be interpreted with this context in mind.)
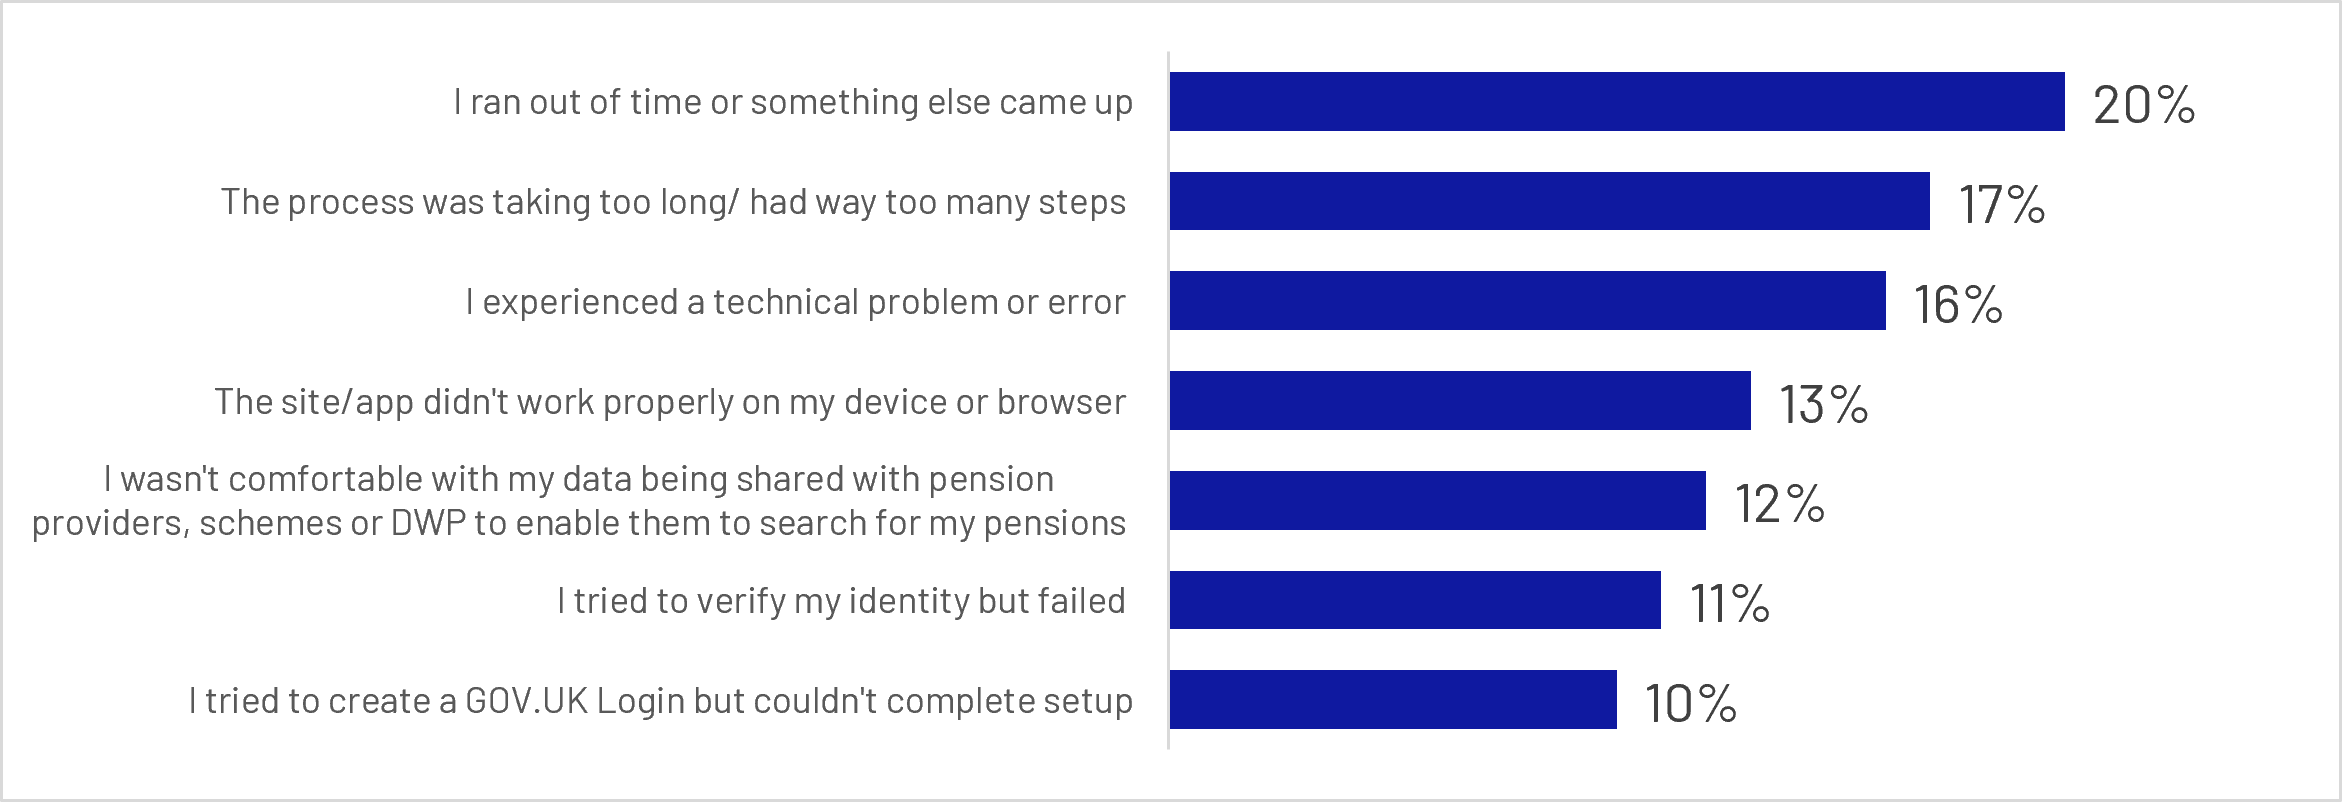
Figure 4.3: Q33: Thinking about your most recent attempt to access the MHPD, why did you stop before completing? (Top 7 reasons)
Base: All who tried to access MHPD since the Wave 1 survey but did not complete the process (n=476 unweighted)
Bar chart showing responses:
- I ran out of time or something else came up: 20%
- The process was taking too long/ had way too many steps: 17%
- I experienced a technical problem or error: 16%
- The site/app didn't work properly on my device or browser: 13%
- I wasn't comfortable with my data being shared with pension providers, schemes or DWP to enable them to search for my pensions: 12%
- I tried to verify my identity but failed: 11%
- I tried to create a GOV.UK Login but couldn't complete setup: 10%
Issues relating to identity verification and One Login account set-up also contributed significantly to drop-off. More than 3 in 10 (35%) respondents reported issues related to One Login, with one in ten reporting failing identity verification (11%), being unable to complete One Login set-up (10%), or not having the required information available when asked to verify their identity (10%). Concerns about data sharing were raised by 12% of unsuccessful users, although concerns about legitimacy or security were less commonly cited.
Overall, these findings suggest that barriers to completion were typically practical rather than motivational, with users more likely to disengage because of process friction, technical issues or identity verification requirements than because of a lack of perceived relevance.
The results of the qualitative research suggest that those who attempted but failed to access the dashboard generally understood its value proposition, typically describing it as a tool to bring all pension information together in one place. Along with users, they were primarily motivated to use the dashboard for visibility and reassurance, rather than active pension management. They wanted to see all their pensions in one place, check that nothing was missing, and understand broadly how much they might receive in retirement, rather than undertake detailed financial planning or manage investments.
“I am really interested [in the dashboard]. I do think it's something that I would really like to use […] The values of my funds, predicted, income, monthly income, for my workplace pension, State Pension prediction, this is what you'll get when you're 67, that sort of information.”
Female participant, Aged 45-54, Tried but failed to access the MHPD, Confused and Concerned Segment
However, several barriers prevented successful access and completion. Identity verification was the most significant barrier, and many non-users dropped out during the GOV.UK One Login process. Participants reported a range of reasons for dropping off at this point, but it was most typically either because verification failed, they were uncomfortable uploading identity documents, or they thought the process would be too much hassle. Perceived lack of clarity about the process increased drop-off. Participants often did not know what information they would need, how long the process would take, or why certain steps were necessary. When participants encountered a longer process than expected, they sometimes stopped because they lacked time or felt it required too much effort at that moment; those who dropped out typically did not attempt to log in again, even though they often felt the dashboard would be useful.
“I did start going into it and then it was asking for lots of different information, things like my National Insurance number. I thought, I don't even know where to find that at the moment.”
Female participant, Aged 65+, Tried but failed to access the MHPD, Retired, Confused and Concerned Segment
Privacy and security concerns were less typical than perceived effort or difficulty using the One Login system, but also contributed to drop-off during identity verification. Some participants were uncomfortable uploading identity documents or completing facial verification without a clear understanding of why this was necessary, where their data would be stored, or whether they were using an official government service. For a small number, nervousness about connecting their details reflected previous negative experiences with other government services, such as the Jobcentre or benefits system. This led to concerns that entering information incorrectly, or linking data across government systems, could trigger unwanted scrutiny or affect their financial circumstances.
“You might appear on a system which could trigger some kind of investigations [because of using ID verification]. A few years ago I was told by the Jobcentre that they didn't want to know about my NHS pension. But then later I got checked and they said, oh yes, it does actually count. So that made me have had an overpayment which I'm actually still paying back.”
Female participant, Aged 55-64, Tried but failed to access the MHPD, Confused and Concerned Segment
4.4 Reasons for non-use
Among those who did not attempt to access the dashboard, lack of time was the most commonly cited reason, mentioned by nearly a third (32%) of non-users. A further 14% said they were satisfied with their current understanding of their pensions, while 12% stated that they had no interest in accessing the dashboard. Smaller proportions reported not seeing the benefits of the service (7%), perceiving the process as too complicated (5%), or having concerns about sharing personal information (4%) or security (4%).
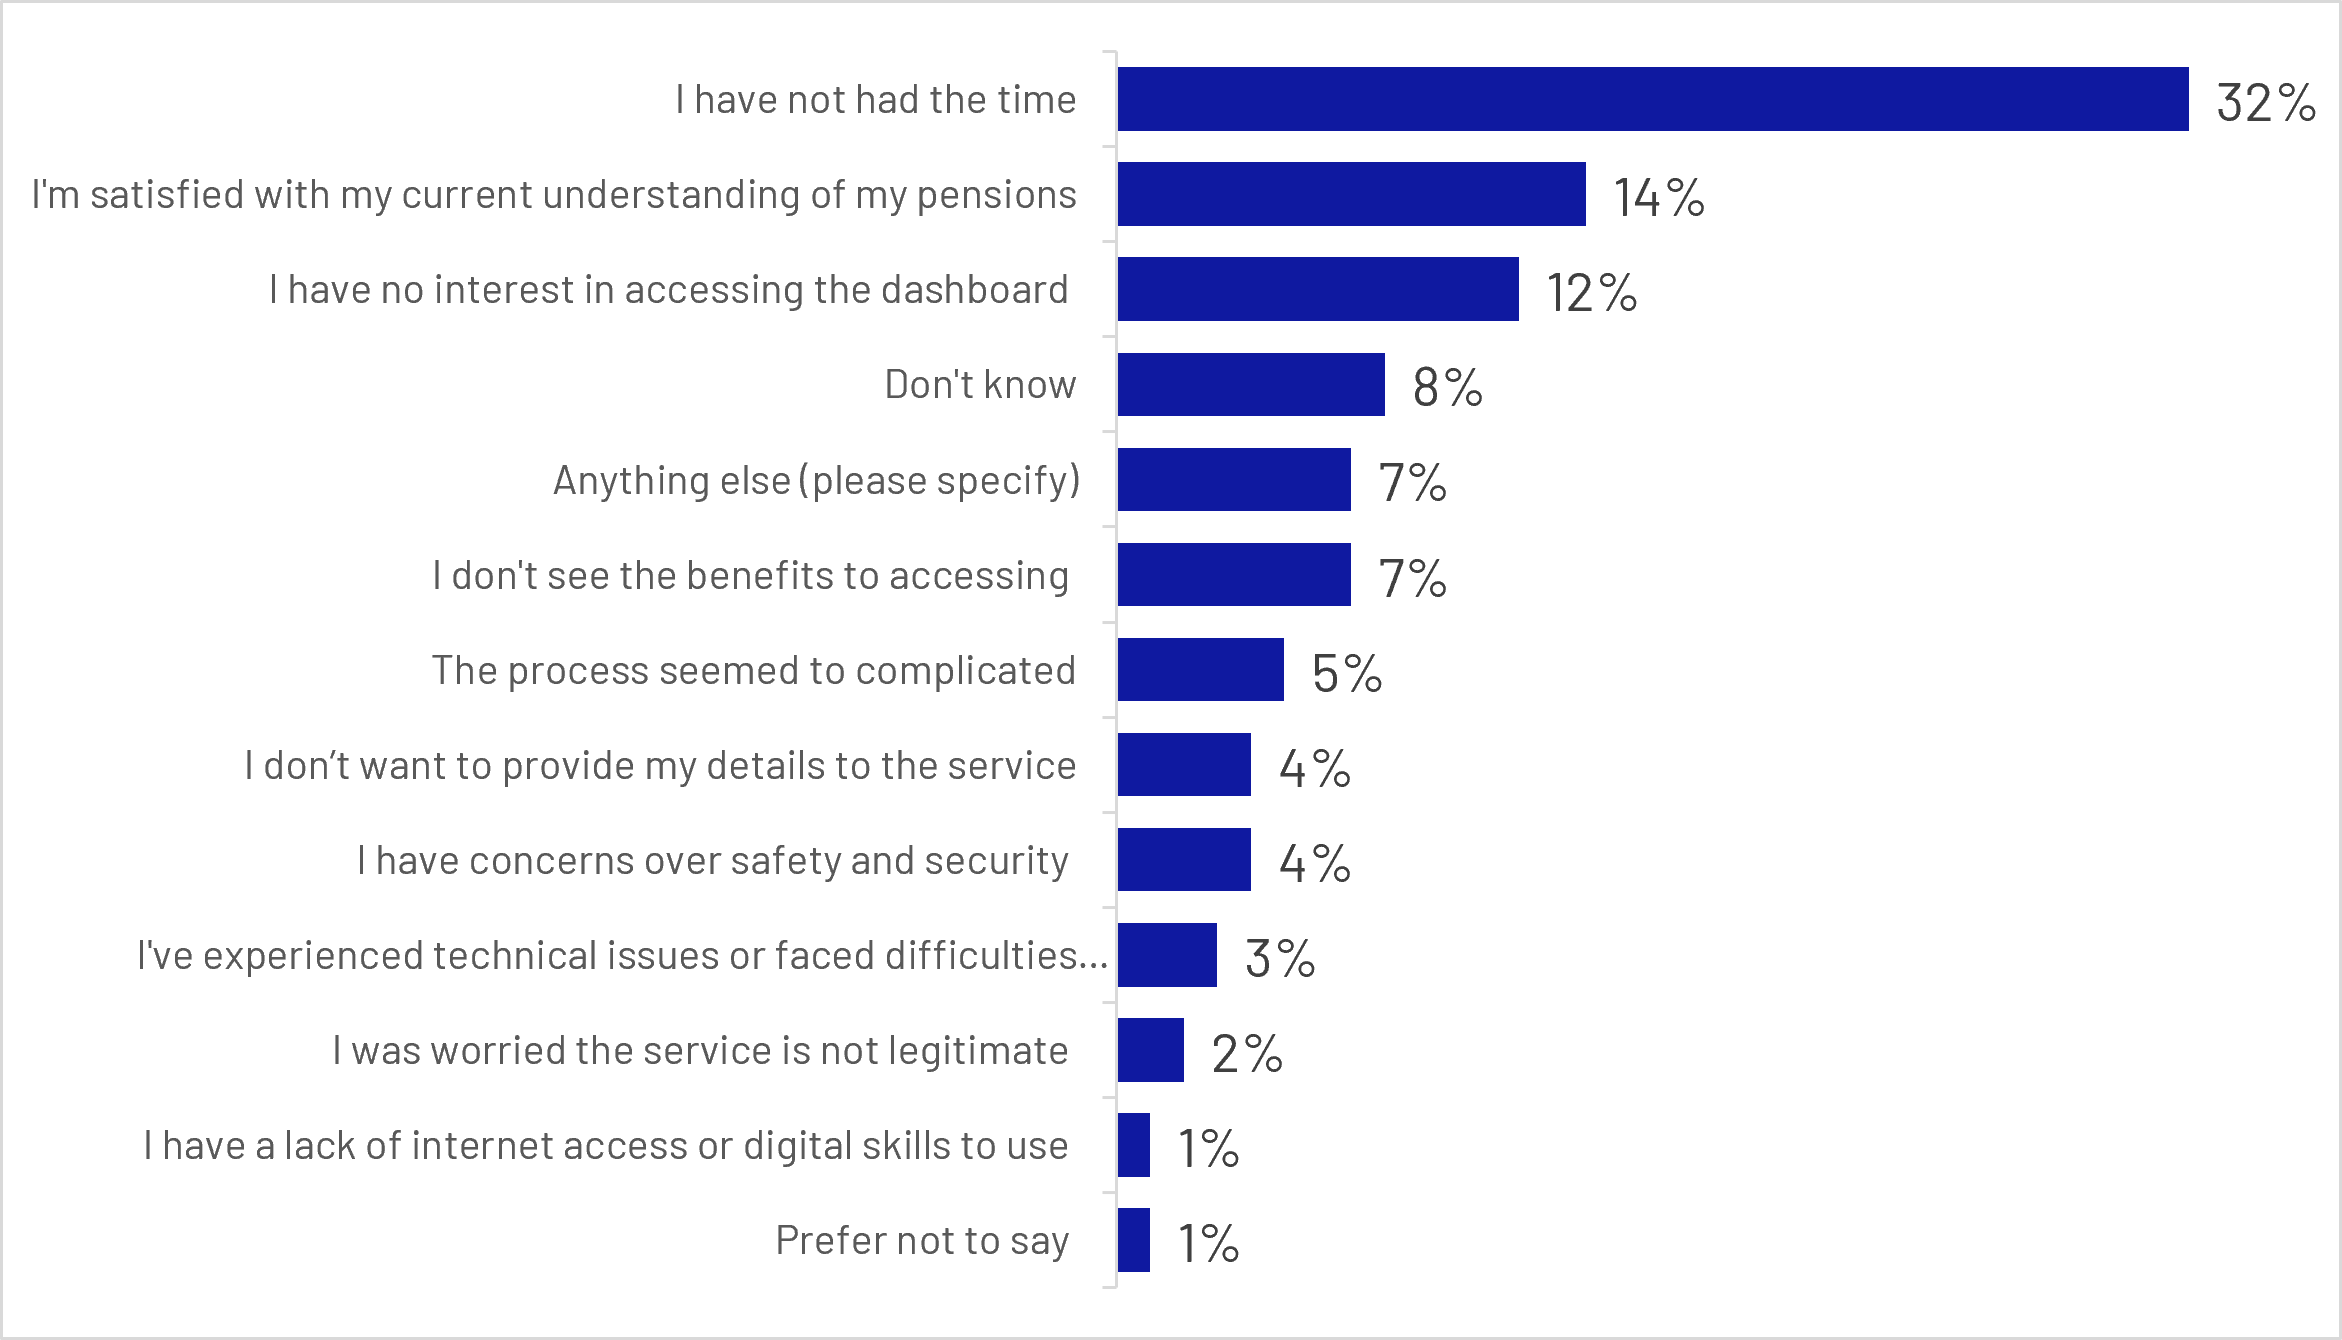
Figure 4.4: Q37: Why have you not tried to access the MHPD?
Base: All those who have not tried to access the MHPD since Wave 1 survey (n= 971 unweighted)
Bar chart:
- I have not had the time: 32%
- I'm satisfied with my current understanding of my pensions: 14%
- I have no interest in accessing the dashboard: 12%
- Don't know: 8%
- Anything else (please specify): 7%
- I don't see the benefits to accessing: 7%
- The process seemed too complicated: 5%
- I don’t want to provide my details to the service: 4%
- I have concerns over safety and security: 4%
- I've experienced technical issues or faced difficulties...: 3%
- I was worried the service is not legitimate: 2%
- I have a lack of internet access or digital skills to use: 1%
- Prefer not to say: 1%
Taken together, these findings suggest that non-use was driven more by competing priorities and perceptions of relevance than by concerns about safety or digital access. For many participants, the primary challenge was creating sufficient motivation to engage with the dashboard in the first place, rather than overcoming concerns about the service itself.
Overall, dashboard uptake was strongest among participants who were already financially engaged, retirement-focused and confident in their understanding of pensions. Successful users tended to be older working-age adults, graduates, homeowners and higher-income households. While a further one in 5 participants attempted to access the dashboard but did not complete the journey, barriers were most commonly related to time, technical difficulties and identity verification requirements. Among non-users, lack of time, satisfaction with existing pension knowledge and lack of interest were the principal reasons for not engaging with the service. These findings suggest that, at this early stage of testing, both consumer motivation and friction within the access journey influenced dashboard uptake and completion.
4.5 Key Driver Analysis: drivers of dashboard uptake and completion
Key Driver Analysis (KDA) was used to identify the factors most strongly associated with progressing through the dashboard journey. The analysis assesses the relative importance of different factors in predicting behaviour, while regression modelling helps to indicate whether each factor is associated with a higher or lower likelihood of progressing through the dashboard journey.
Separate models were developed to identify which factors were most strongly associated with attempting to access the dashboard, and for identifying which factors were most strongly associated with successfully completing the access journey. Relative importance indicates how much a factor contributes to explaining dashboard progression overall, whereas odds ratios describe the size and direction of the relationship for that specific factor.
Confidence and engagement with pension information were the strongest drivers of dashboard take-up, followed by education level. KDA identified various forms of confidence and engagement with pensions as the strongest predictors of attempted dashboard access. The single strongest driver was confidence in understanding pension contribution amounts (Q15). Respondents who were more confident that they knew exactly how much they were contributing to their pension were significantly more likely to attempt access (Odds Ratio =1.75). This suggests that consumers who are already actively engaged with their pension arrangements are considerably more likely to engage with the dashboard.
This finding was reinforced by other key drivers in the model (see figure 4.5 below).
Respondents who had read financial articles online in the past 12 months and those who had spoken to their pension provider in the past 12 months were also significantly more likely to attempt dashboard access. Together, these results suggest that dashboard take-up was highest among individuals who were already actively engaged with understanding and managing their retirement finances. Educational attainment was also associated with dashboard take-up, with degree holders having higher odds of attempting access than non-degree holders (Odds Ratio = 1.41).
Alongside these engagement-related factors, some demographic differences were also evident. Respondents from ethnic minority backgrounds had lower odds of attempting dashboard access than White respondents (Odds Ratio = 0.84).
Overall, the factors associated with attempting dashboard access were predominantly measures of pension engagement, pension knowledge, information-seeking behaviours and confidence in managing retirement finances.
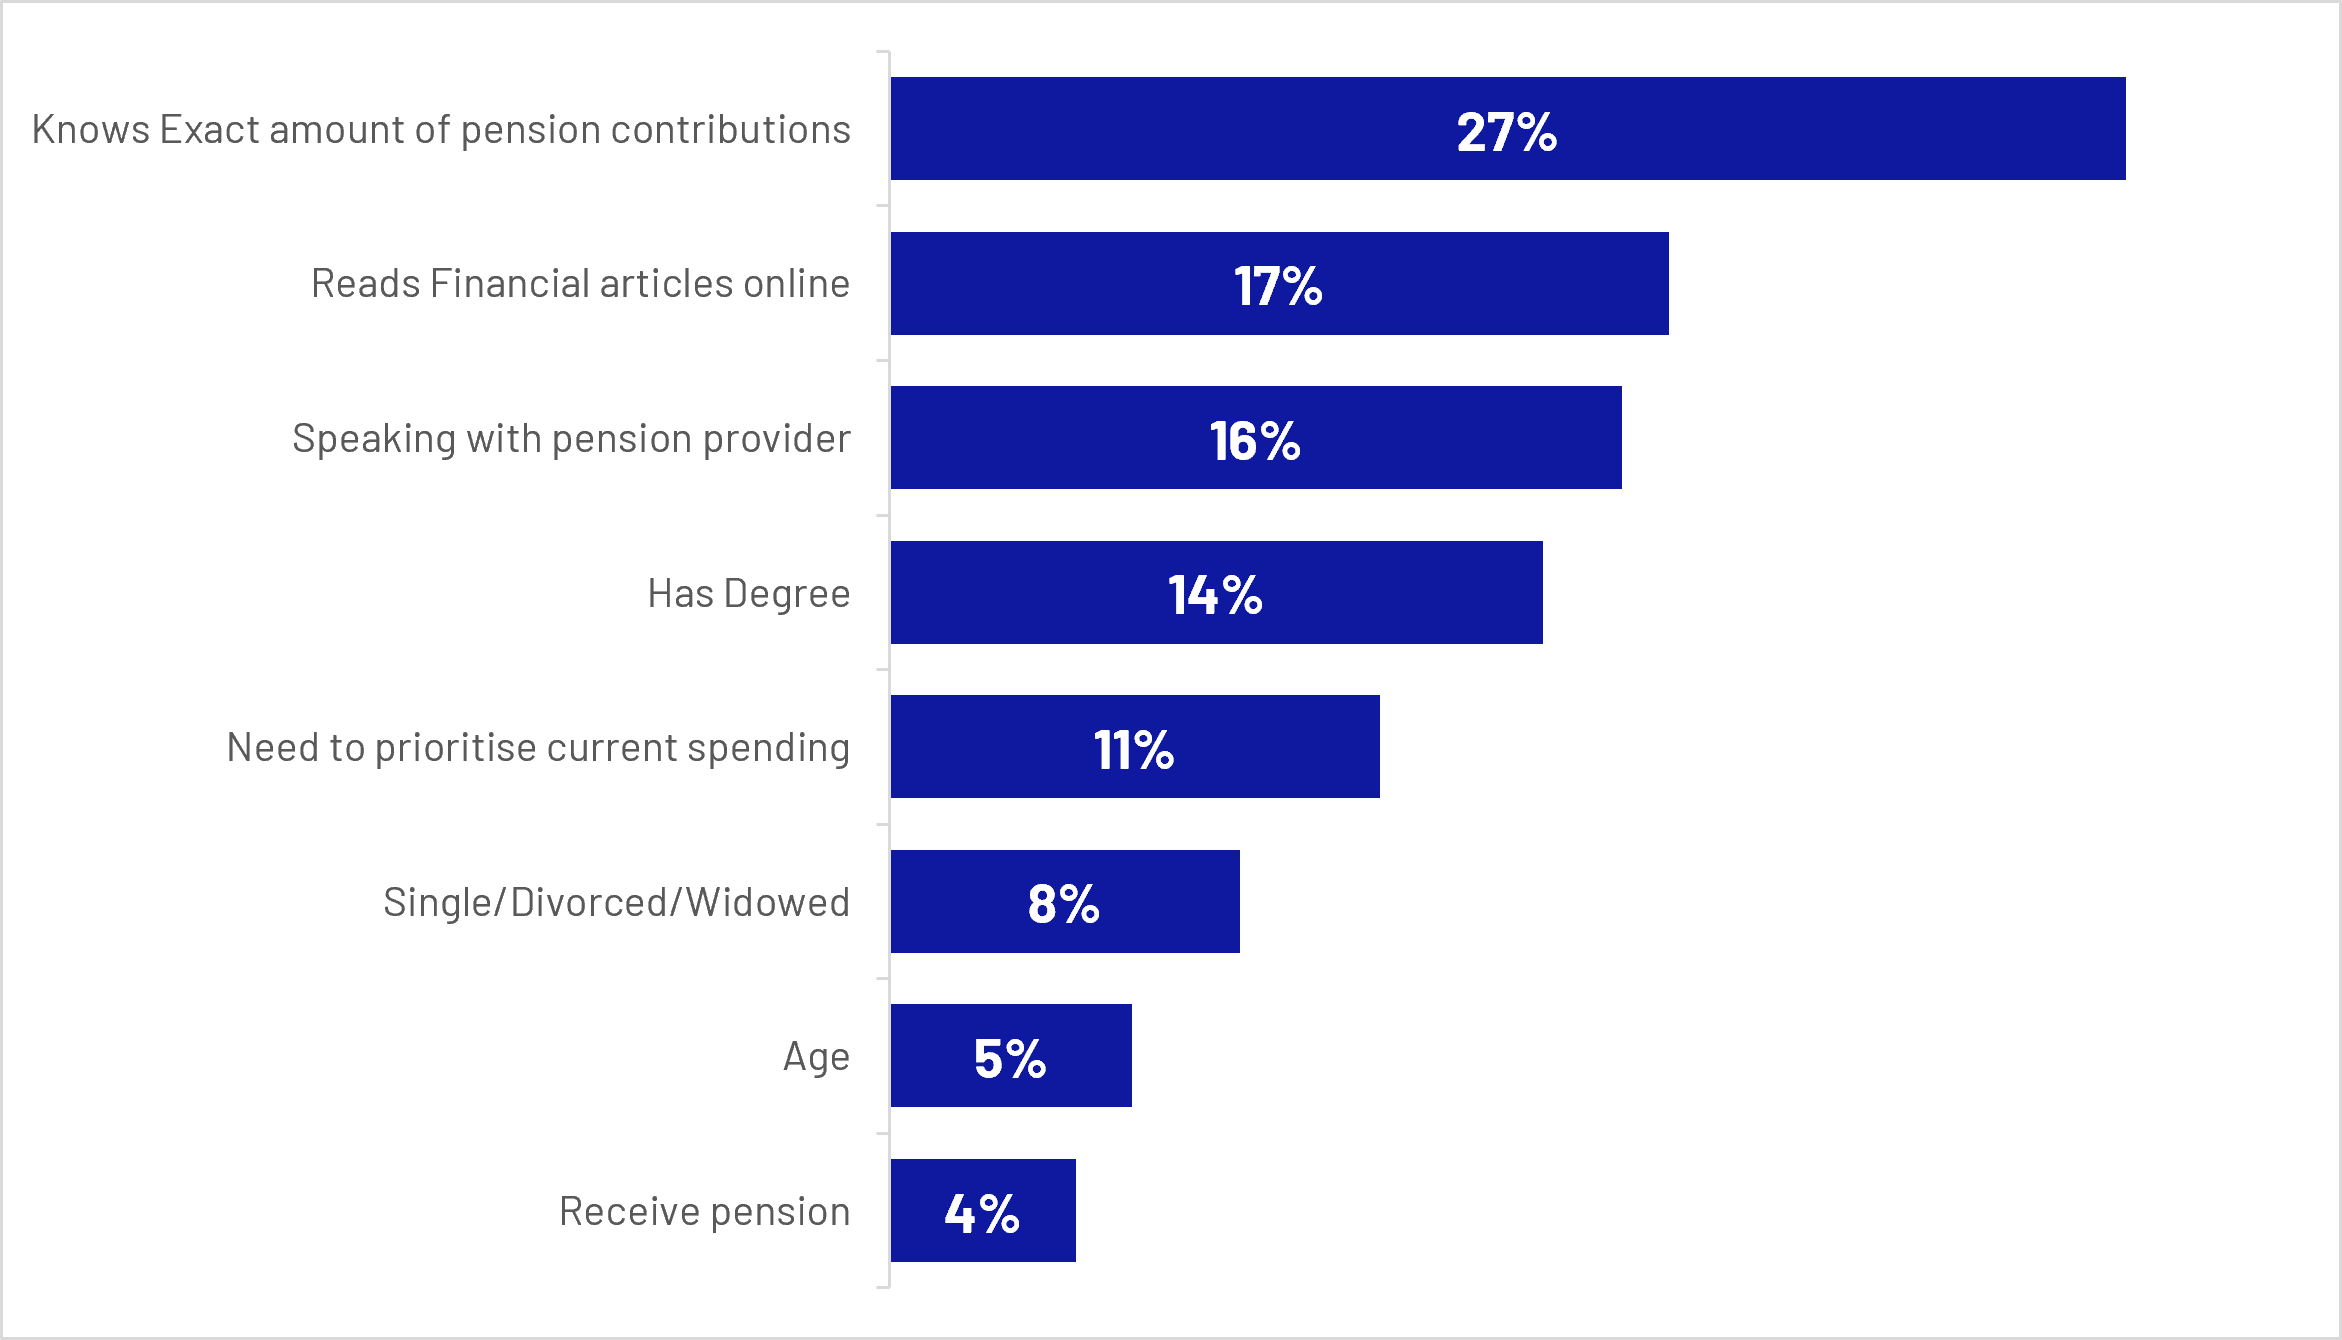
Figure 4.5: Relative importance of drivers of dashboard uptake (Key Driver Analysis)
Bar chart:
- Knows Exact amount of pension contributions: 27%
- Reads Financial articles online: 17%
- Speaking with pension provider: 16%
- Has Degree: 14%
- Need to prioritise current spending: 11%
- Single/Divorced/Widowed: 8%
- Age: 5%
- Receive pension: 4%
The strongest driver of successful dashboard access was whether respondents had already completed identity verification through GOV.UK One Login, which was almost twice as important as the next most influential factor. Respondents who had already successfully proved their identity had higher odds of successfully accessing the dashboard than those who had never heard of One Login (Odds Ratio = 1.15). By contrast, simply being aware of GOV.UK One Login or having an account without completing identity verification was not associated with higher completion rates (see Figure 4.6 below).
Beyond GOV.UK One Login readiness, a small number of demographic characteristics were also associated with successful dashboard access. Single, divorced and widowed respondents were significantly more likely to successfully complete the journey than those who were married or in a partnership (Odds Ratio = 1.19). Ethnic minority respondents were significantly less likely to successfully access the dashboard than White respondents (Odds Ratio= 0.84) , although both of these factors were considerably less influential than successful completion of the GOV.UK One Login identity verification process.
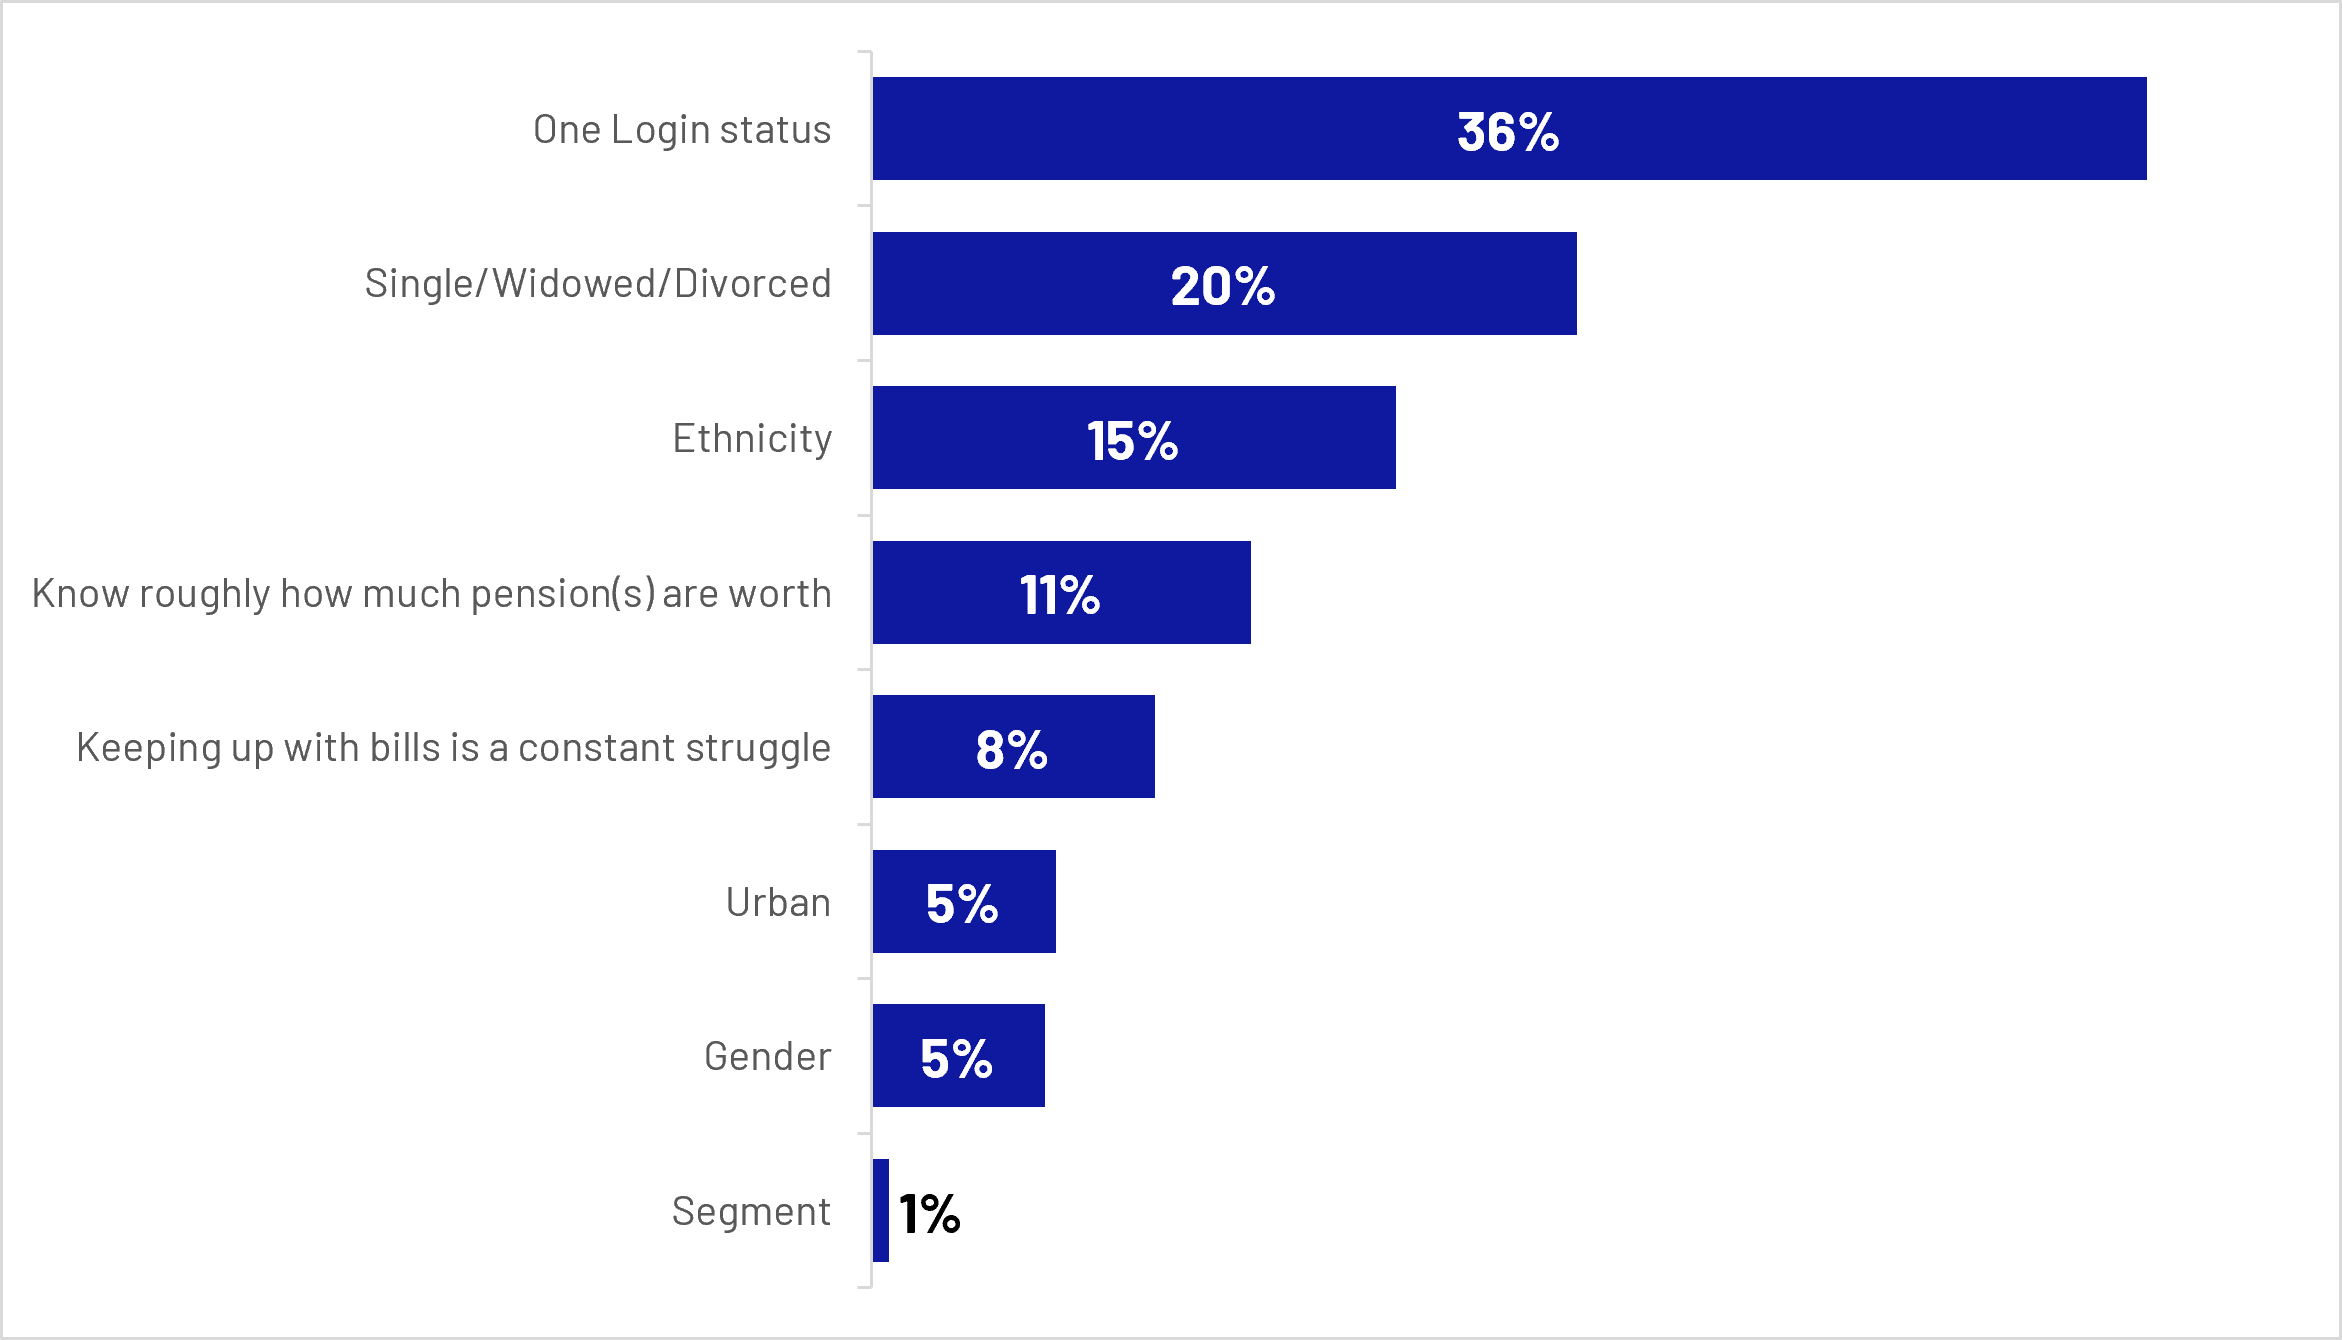
Figure 4.6: Relative importance of drivers of successful dashboard access (Key Driver Analysis)
Bar chart:
- One Login status: 36%
- Single/Widowed/Divorced: 20%
- Ethnicity: 15%
- Know roughly how much pension(s) are worth: 11%
- Keeping up with bills is a constant struggle: 8%
- Urban: 5%
- Gender: 5%
- Segment: 1%
Increasing overall dashboard usage is therefore likely to depend on both strengthening consumer motivation to engage with pensions and reducing barriers within the access journey. KDA findings suggest that engagement with pensions and retirement planning is the primary driver of dashboard take-up, while successful completion depends heavily on readiness to navigate GOV.UK One Login and identity verification. Practical challenges at this stage remain important obstacles to completion and may contribute to lower access rates among some demographic groups, including ethnic minority respondents.
Back to top5. User experience of the dashboard
This section explores overall satisfaction, perceptions of the information and functionality provided, experiences of pension matching, and the extent to which users were able to achieve their objectives when using the dashboard. It also highlights areas where users encountered challenges or unmet expectations.
5.1 Satisfaction
Among those who successfully accessed the dashboard, overall sentiment was positive. Three quarters of users (75%) reported being satisfied with their experience, including 36% who were very satisfied, while 10% expressed dissatisfaction. These findings indicate that most users viewed their initial experience of the dashboard favourably.
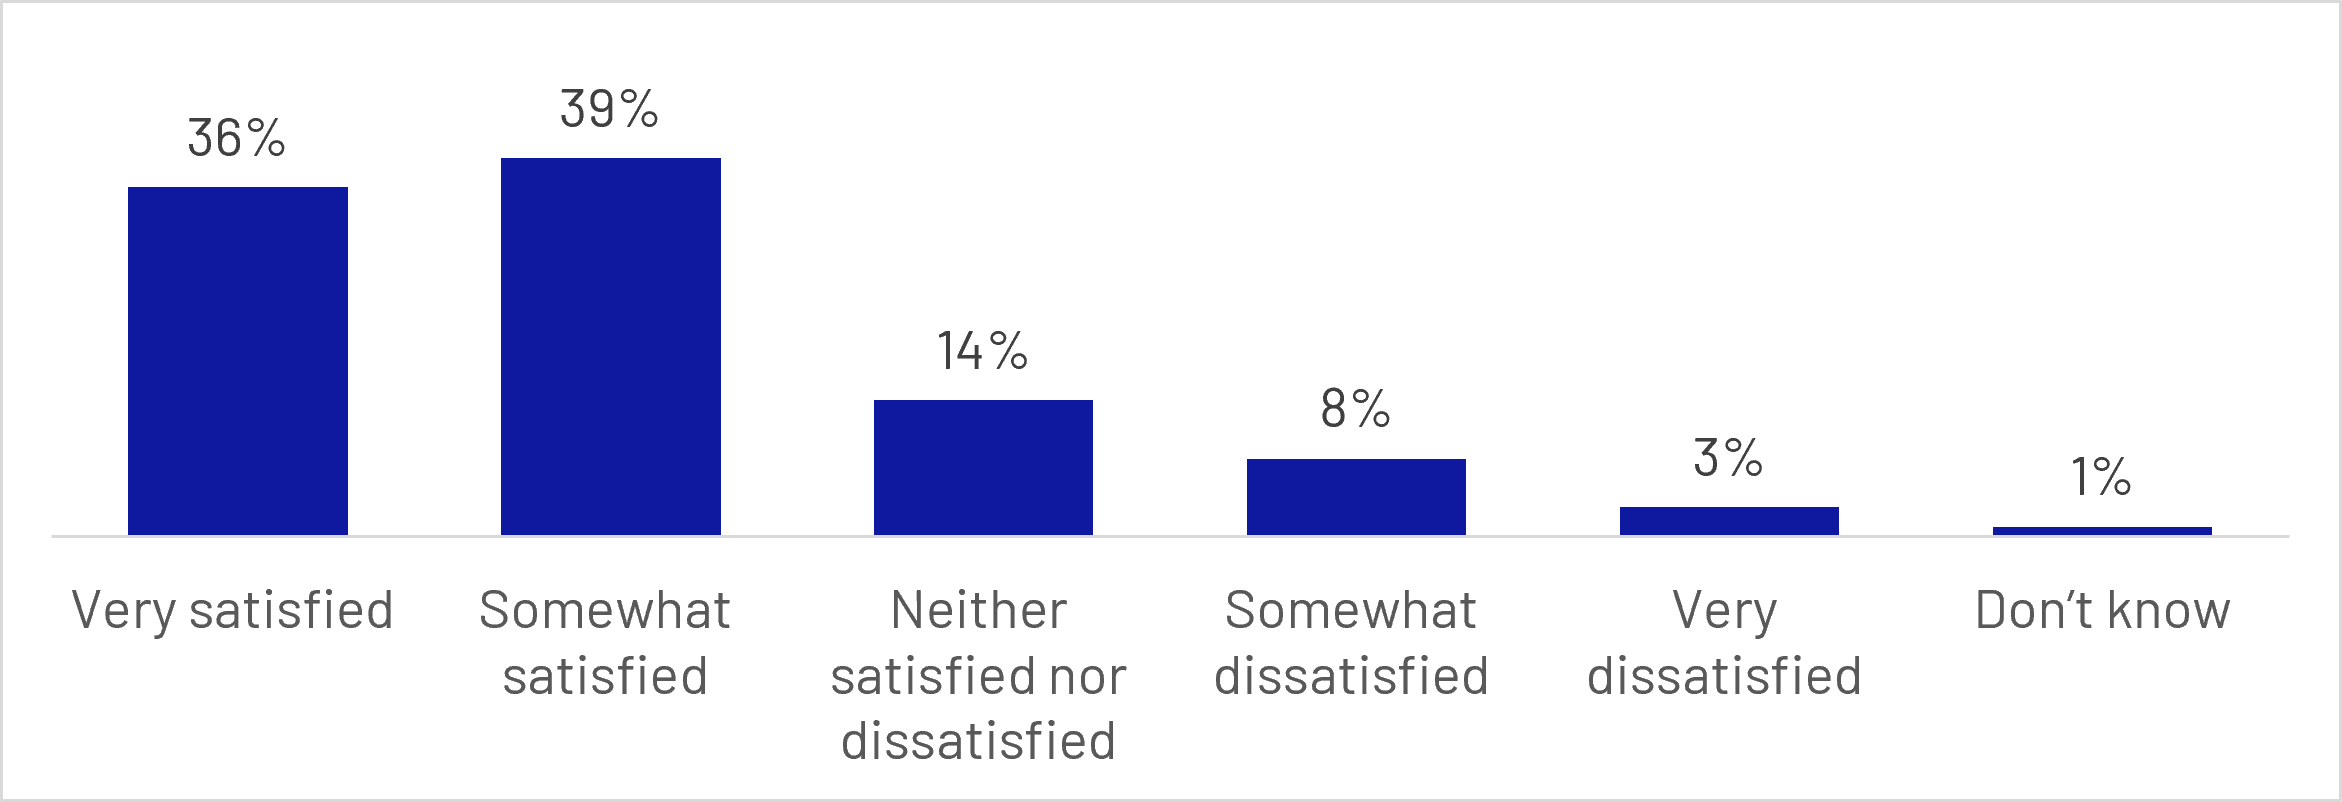
Figure 5.1: Q34: Overall, how satisfied are you, if at all, with your experience on the MHPD?
Base: All who have accessed the MHPD since the Wave 1 survey (Q20) (n=595 unweighted)
Bar chart:
- Very satisfied: 36%
- Somewhat satisfied: 39%
- Neither satisfied nor dissatisfied: 14%
- Somewhat dissatisfied: 8%
- Very dissatisfied: 3%
- Don’t know: 1%
Positive perceptions were also reflected in users' future intentions. Nearly three quarters (73%) were either likely to or already had recommended the dashboard to friends or family, while 81% said they would be likely to use the dashboard again in future. Together, these findings suggest that the dashboard generated a strong level of goodwill amongst users and that many saw value in returning to the service after their initial visit.
Most users accessed the dashboard only once (67%), although around a third returned on multiple occasions between accessing the dashboard and completing the survey. Among repeat users, the most common reason for returning was to review their results again (61%), followed by checking for updates relating to pensions in the pending pensions channel (27%).
Only a small proportion of participants (5%) reported engaging with technical support. Among those who did, over half (56%) felt that the support either met or exceeded their needs, while 28% said it did not meet their needs. Given the small number of respondents who used technical support (n=48), these findings should be treated as indicative rather than conclusive. Q21: How many times have you accessed the MHPD?
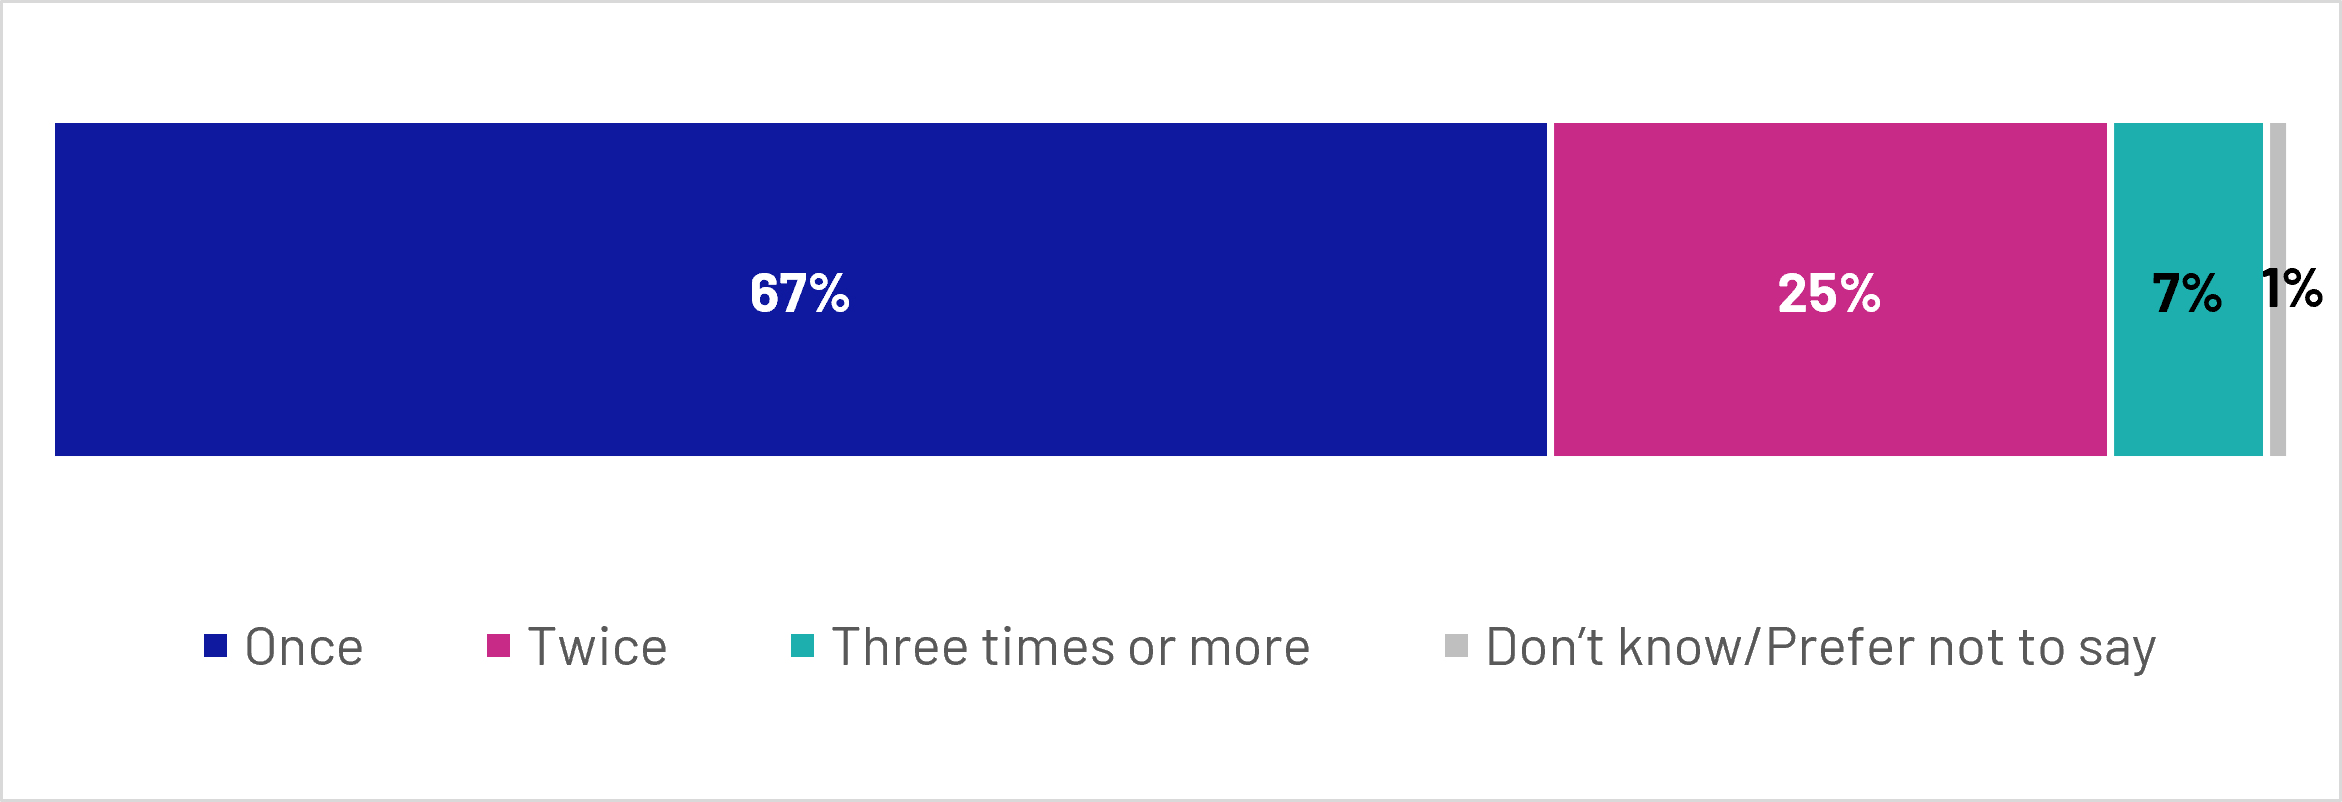
Figure 5.2: Q21: In total, how many times have you accessed the MHPD?
Base: All who have accessed MHPD since Wave 1 survey (Q20) (n=595 unweighted)
Stacked bar chart:
- Once: 67%
- Twice: 25%
- Three times or more: 7%
- Don’t know/Prefer not to say: 1%
Satisfaction was strongest in relation to the clarity and accessibility of the dashboard experience. More than 8 in 10 users (81%) were satisfied with their ability to understand the information presented, making this the highest-rated aspect of the service. Satisfaction was also high in relation to the ease of accessing and completing the process (78%) and the time taken for pension values to be displayed (75%). These results indicate that users generally found the dashboard straightforward to navigate and the information easy to interpret.
However, perceptions were somewhat less positive in relation to the recency of the information displayed. While a majority (65%) were satisfied that the values shown on the dashboard were up to date, this represented the lowest rated aspect of the user experience. Around one in 7 (14%) expressed dissatisfaction with how up to date the pension values were, suggesting that information timeliness remains an area with greater potential for improvement, although this may have been impacted by known missing pensions related to certain industries at the time of user testing. There was a substantial overlap between perceptions of accuracy and recency. Among respondents who disagreed that the pensions values were accurate, 87% also disagreed that the values were up to date. This suggests that most respondents are not considering accuracy and recency as fully separate concepts. Given that pension values can be up to 2 years old while still complying with regulatory requirements, some users may have viewed older values as less reliable or trustworthy, contributing to the close relationship between perceptions of recency and accuracy.
Users also responded positively to a range of measures assessing the usefulness and credibility of the information provided. Around 7 in 10 agreed that the dashboard was useful for understanding who their pensions were with (69%) and that it helped them understand the current value of their pensions (68%). Around two thirds agreed that the overall information shown was accurate (65%), that pension values were accurate (64%), and that pension values were up to date (63%). Although positive overall, these findings suggest that confidence in the completeness and accuracy of pension information was somewhat weaker than ratings relating to usability and clarity.
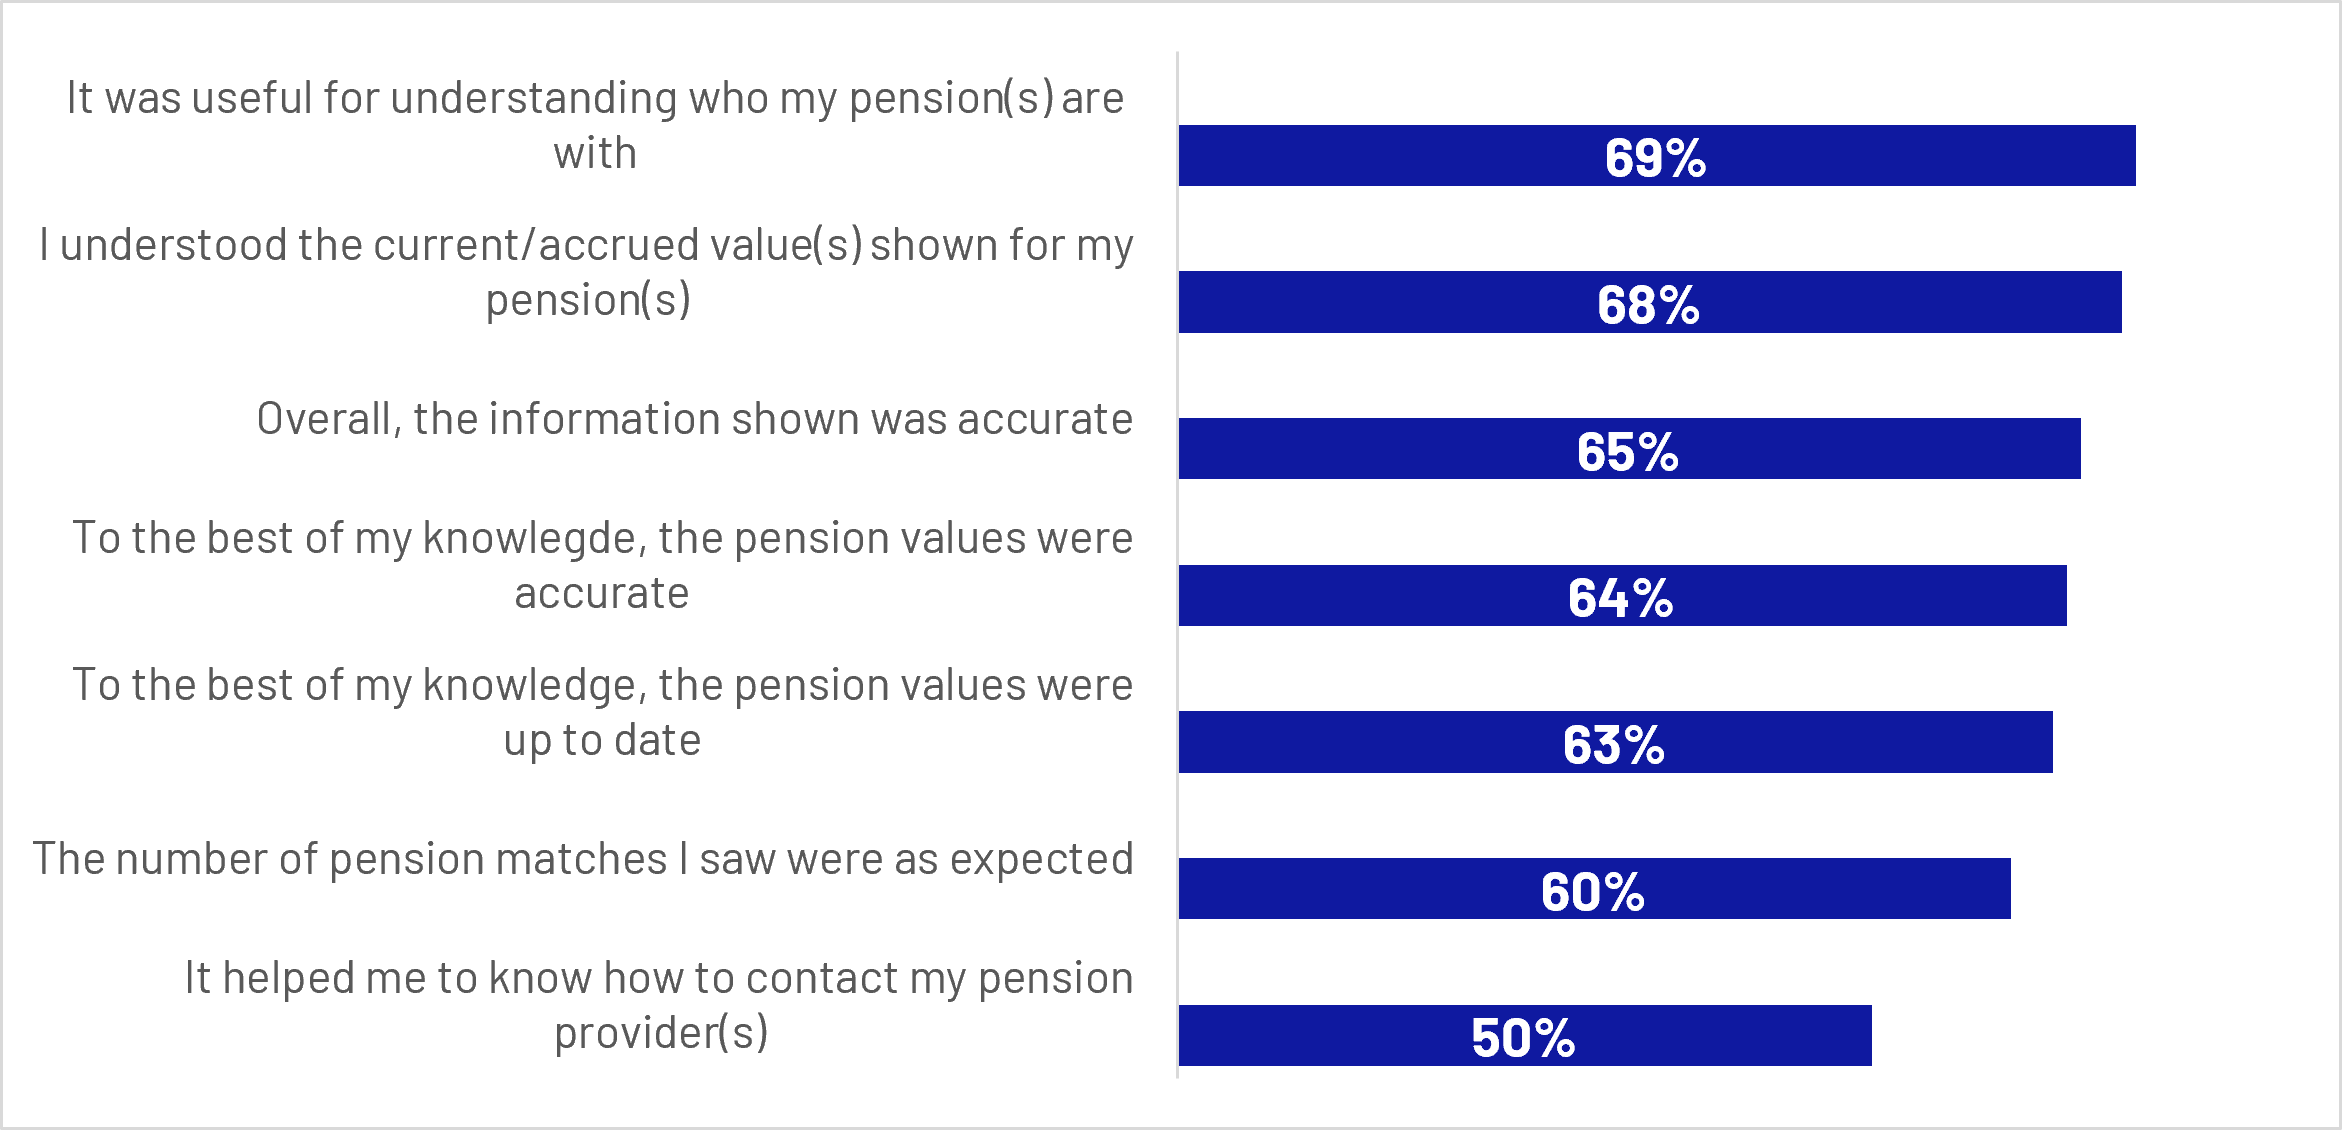
Figure 5.3: Q23: To what extent do you agree or disagree, if at all, with the following statements about the MHPD? (Showing all who strongly agreed or agreed with each statement)
Base: All who have accessed MHPD since Wave 1 survey (Q20) (n=595 unweighted)
Bar chart:
- It was useful for understanding who my pension(s) are with: 69%
- I understood the current/accrued value(s) shown for my pension(s): 68%
- Overall, the information shown was accurate: 65%
- To the best of my knowledge, the pension values were accurate: 64%
- To the best of my knowledge, the pension values were up to date: 63%
- The number of pension matches I saw were as expected: 60%
- It helped me to know how to contact my pension provider(s): 50%
The qualitative findings reflected this overall pattern, with participants reporting that their satisfaction was driven primarily by the dashboard’s clear presentation, straightforward navigation and ability to bring pension information together in one place.
“It was really easy to access and it gives me everything that I have in one place on one screen, and then I can choose to go into each of those individually and look at them more.”
Male participant, Aged 18-24, MHPD User, Confused and Concerned Segment
Users also valued the dashboard as a convenient source of visibility and reassurance, particularly where it confirmed information they already held or helped them identify their pension providers and values.
“Three pensions were there and the estimated income and it was a bit of an eye-opener really […] Seeing the estimated figure really, really did sort of gel with me. I guess it gave me a little bit of peace of mind.”
Male participant, Aged 45-54, MHPD User, Confident and Passive Segment
Users typically reported that the information on the dashboard appeared accurate, particularly where they were able to compare it with pension provider apps, statements or other government sources. This helped strengthen trust in the service and provided reassurance that their pension information was correct.
“I was quite impressed that it managed to pull all the correct information in. You don't know sometimes how various different systems all talk to each other or whether something's going to be out of date or in date, but everything looked as I expected it to be.”
Male participant, Aged 25-34, MHPD User, Confident and Passive Segment
5.2 Matching outcomes
The majority of users were successful in obtaining the information they were looking for. Seven in 10 (70%) reported that they were able to find the information they needed on the dashboard, while 65% said they were able to view pension values for all pensions that were found.
In addition to locating pension information, many users reported improvements in their awareness of their pension arrangements. Around 7 in 10 (69%) agreed that the dashboard was useful for understanding where their pensions were held. This suggests that, beyond providing pension values, the dashboard played an important role in helping users build a more complete understanding of their pension landscape.
Nevertheless, some users encountered gaps in the information available to them. While most felt that the number of pension matches they received met expectations, nearly three in ten (29%) disagreed that the number of matches was as expected, indicating that pension matching remained an area where user expectations were not always met.
5.3 Lost and missing pensions
One of the most notable outcomes of dashboard use was the ability to identify pensions that users had either lost track of or were previously unaware of. Around one in 8 users (12%) reported discovering a lost or unknown pension through the dashboard. Among those who located a lost pension, the majority (77%) found one lost pension, while a smaller proportion identified 2 (17%) or 3 or more (6%). Although based on a relatively small number of users, these findings illustrate the potential value of dashboards in reconnecting individuals with retirement savings that may otherwise have remained overlooked.
At the same time, missing pensions were a significant source of frustration for some users. Nearly one third (32%) reported that pensions they expected to see were not included in their dashboard results. Among these users, around 4 in 10 (39%) indicated that the missing pensions related to occupations associated with large schemes that had not yet connected to the dashboard. This suggests that some dissatisfaction may reflect the phased nature of dashboard implementation rather than deficiencies in the dashboard itself.
Among participants in the qualitative research, finding lost pensions was part of the perceived value of the dashboard but was uncommon in practice. In the few instances where participants had found lost pensions, they did not represent significant value and therefore did not dramatically influence their experience of using the dashboard. However, participants perceived a benefit in confirming that no pensions had been overlooked, which gave participants peace of mind that the information they already had was correct.
“I did find one that I remember I had opened and then I'd forgot it was still open and it was listed there. But that was empty because I had set it up and then changed my mind.”
Male participant, Aged 18-24, MHPD User, Confused and Concerned
However, for some users missing pensions, pending results, outdated values or figures that differed from provider records could cause disappointment and reduce confidence in the service, even where the dashboard itself remained easy to use. Where information was missing or outdated, users could make repeated visits to review information or check whether missing or pending pensions had appeared, suggesting that completeness and recency will be important in converting initial goodwill into sustained use and trust in the service. Some users wanted clearer explanations of how values were calculated, so that they could better understand why these might differ from their expectations.
Well, there were a lot of things missing [...] My workplace pension wasn't there at all. My private pensions was there but I was confused how they got to that figure. I know how to handle that pension so I wouldn't really worry, but I don't know how they [the dashboard] got to that figure.”
Male participant, Aged 65+, Retired, MHPD User, Confused and Concerned
6. Early outcomes of dashboard use
By comparing dashboard users and non-users at Wave 2, alongside changes observed between the baseline and follow-up surveys, this section explores the extent to which dashboard access is linked to stronger pension engagement and greater confidence in managing retirement finances.
6.1 Key quantitative findings
Longitudinal analysis of respondents who completed both survey waves suggests that accessing the dashboard was associated with some improvements in users’ awareness and confidence, although there was limited evidence of changes in retirement-planning behaviour.
Dashboard users were more likely than non-users to give a different estimate of the number of pensions they held at Wave 2. Around 3 in 10 users revised their estimate between waves (29%), compared with around one in 5 non-users (19%), while 71% of users and 81% of non-users gave the same answer at both waves. Among users, changes were generally towards higher pension-number categories: the proportion reporting 3 to 4 pensions significantly increased from 20% to 31%, while the proportion reporting 5 or more significantly increased from 2% to 6%. This provides some indication that accessing the dashboard may have helped users develop a more complete picture of their pension holdings, although changes in responses may also reflect some natural variation between survey waves.
By comparison, there was very little change among non-users. Although around 2 in 10 non-users also changed their answer between wave, these changes broadly balanced out across the categories, leaving the overall distribution unchanged. This overall pattern suggests that the dashboard may have helped some users identify pension pots they had not previously accounted for, leading to a more complete understanding of their overall pension holdings.
The largest observed changes were in broader measures of pension awareness and retirement preparedness. Among dashboard users, agreement that they knew roughly how much their pensions were worth significantly increased by 12 percentage points (from 56% in Wave 1 to 68% in Wave 2), compared with a non-significant change of 3 percentage points among non-users. Among users, agreement that respondents did not know where to start when planning for retirement significantly fell by 9 percentage points (from 34% in Wave 1 to 25% in Wave 2), compared with a non-significant 2-point decline among non-users.
Confidence levels among dashboard users remained broadly stable across all pension topics measured. Although confidence was slightly higher at Wave 2 than at Wave 1 for each topic, none of the observed increases were statistically significant. The largest directional increases were in confidence about knowing the exact amount of pension contributions and identifying key pension features, both of which rose by 5 percentage points.
6.2 Understanding
While dashboard users were more likely than non-users to report knowing how many pensions they held, this difference was already evident before dashboard use, with just 1% of eventual users saying they did not know their number of pensions at Wave 1. This suggests that the dashboard itself is not the sole driver of the difference between these groups.
Prior to dashboard access, future dashboard users also already reported a stronger understanding of pensions than those who did not go on to use the service. At Wave 1, around half (52%) agreed that they understood enough about pensions to make decisions about saving for retirement, compared with 42% of non-users.
At an overall population level, understanding improved between baseline and follow-up. Among those not retired, agreement that they understood enough about pensions to make decisions about saving for retirement increased from 37% at baseline to 44% at Wave 2, a statistically significant increase, while net agreement shifted from -2 percentage points to +7 percentage points.
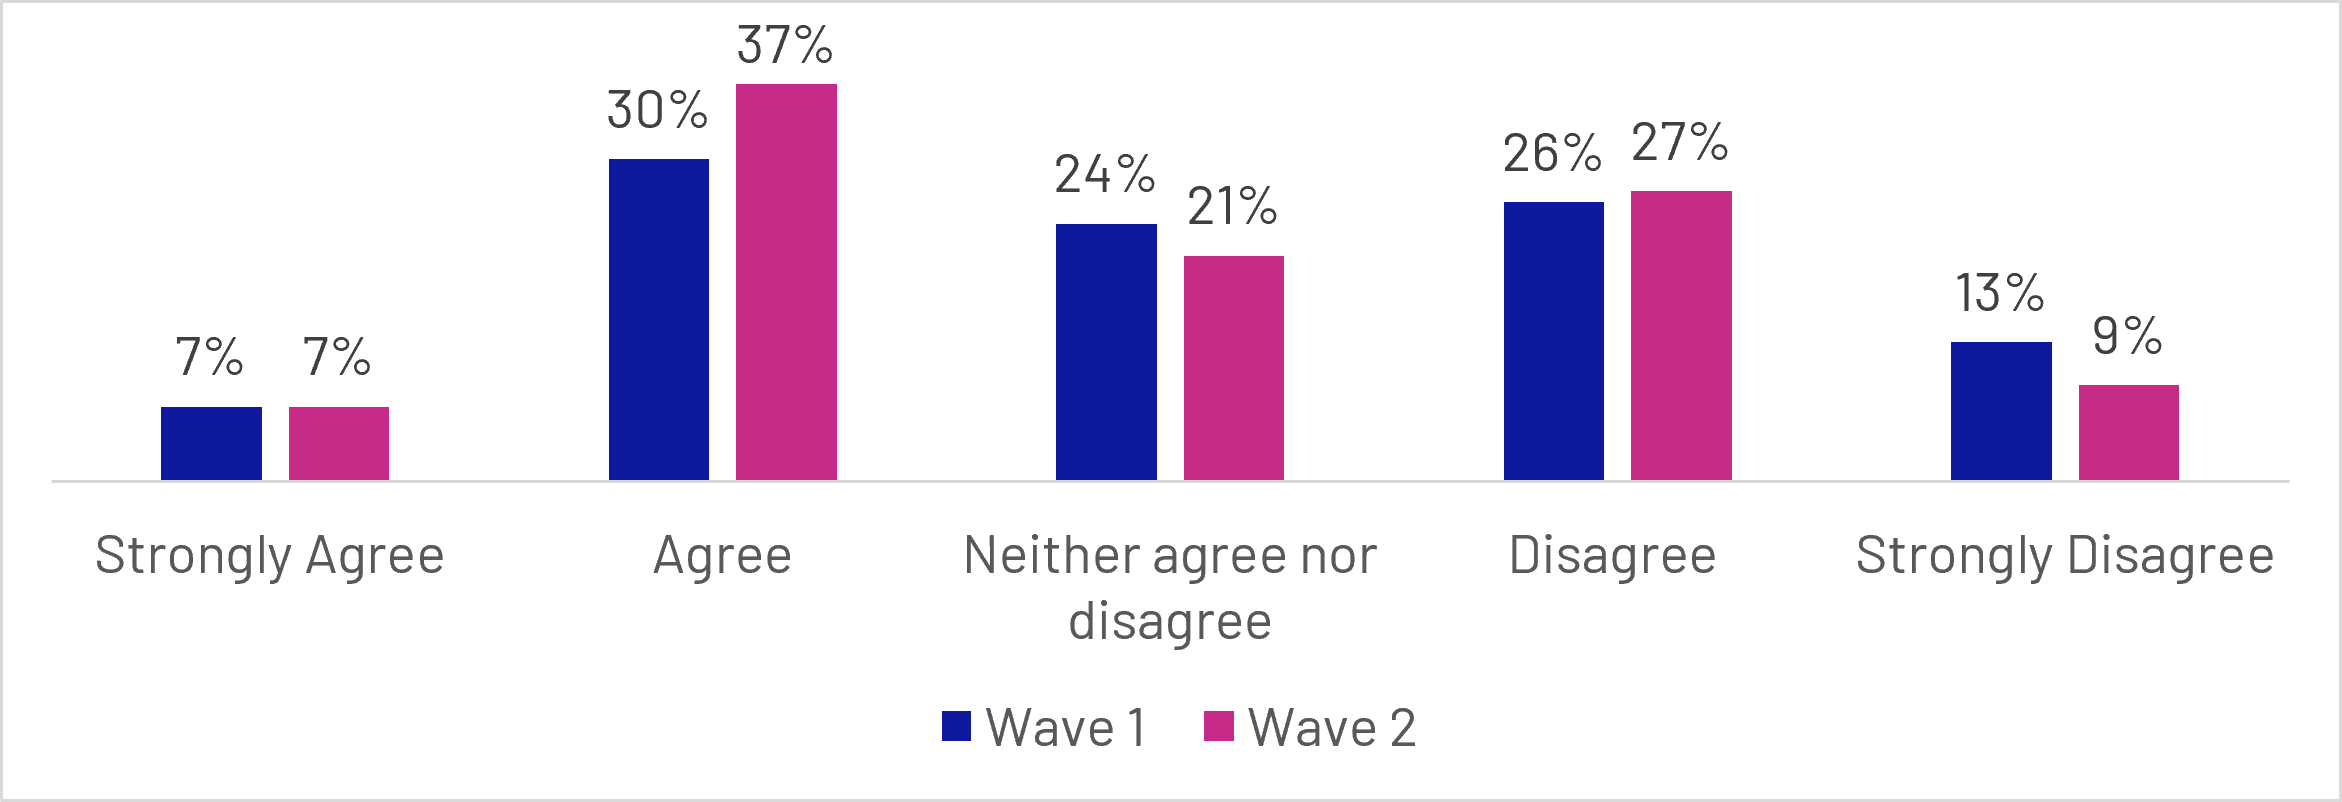
Figure 6.1: To what extent do you agree or disagree, if at all with: I understand enough about pensions to make decisions about saving for retirement?
Base: All not retired or answering don’t know or prefer not to say (n= 4871 total unweighted)
Grouped bar chart comparing Wave 1 and Wave 2 responses:
- Strongly agree: Wave 1 (7%), Wave 2 (7%)
- Agree: Wave 1 (30%), Wave 2 (37%)
- Neither agree nor disagree: Wave 1 (24%), Wave 2 (21%)
- Disagree: Wave 1 (26%), Wave 2 (27%)
- Strongly disagree: Wave 1 (13%), Wave 2 (9%)
For users, the proportion agreeing that they understood enough about pensions to make decisions about saving for retirement increased slightly, from 51% at Wave 1 to 55% at Wave 2. By contrast, agreement among non-users fell marginally from 42% to 40%. Neither change was statistically significant. Taken together, the findings provide some indication that the dashboard helped users develop a more complete picture of their pension circumstances, particularly as users were more likely to revise their estimates of how many pensions they held. However, as this was not reflected in a statistically significant increase in self-reported understanding among dashboard users, this evidence should be considered tentative.
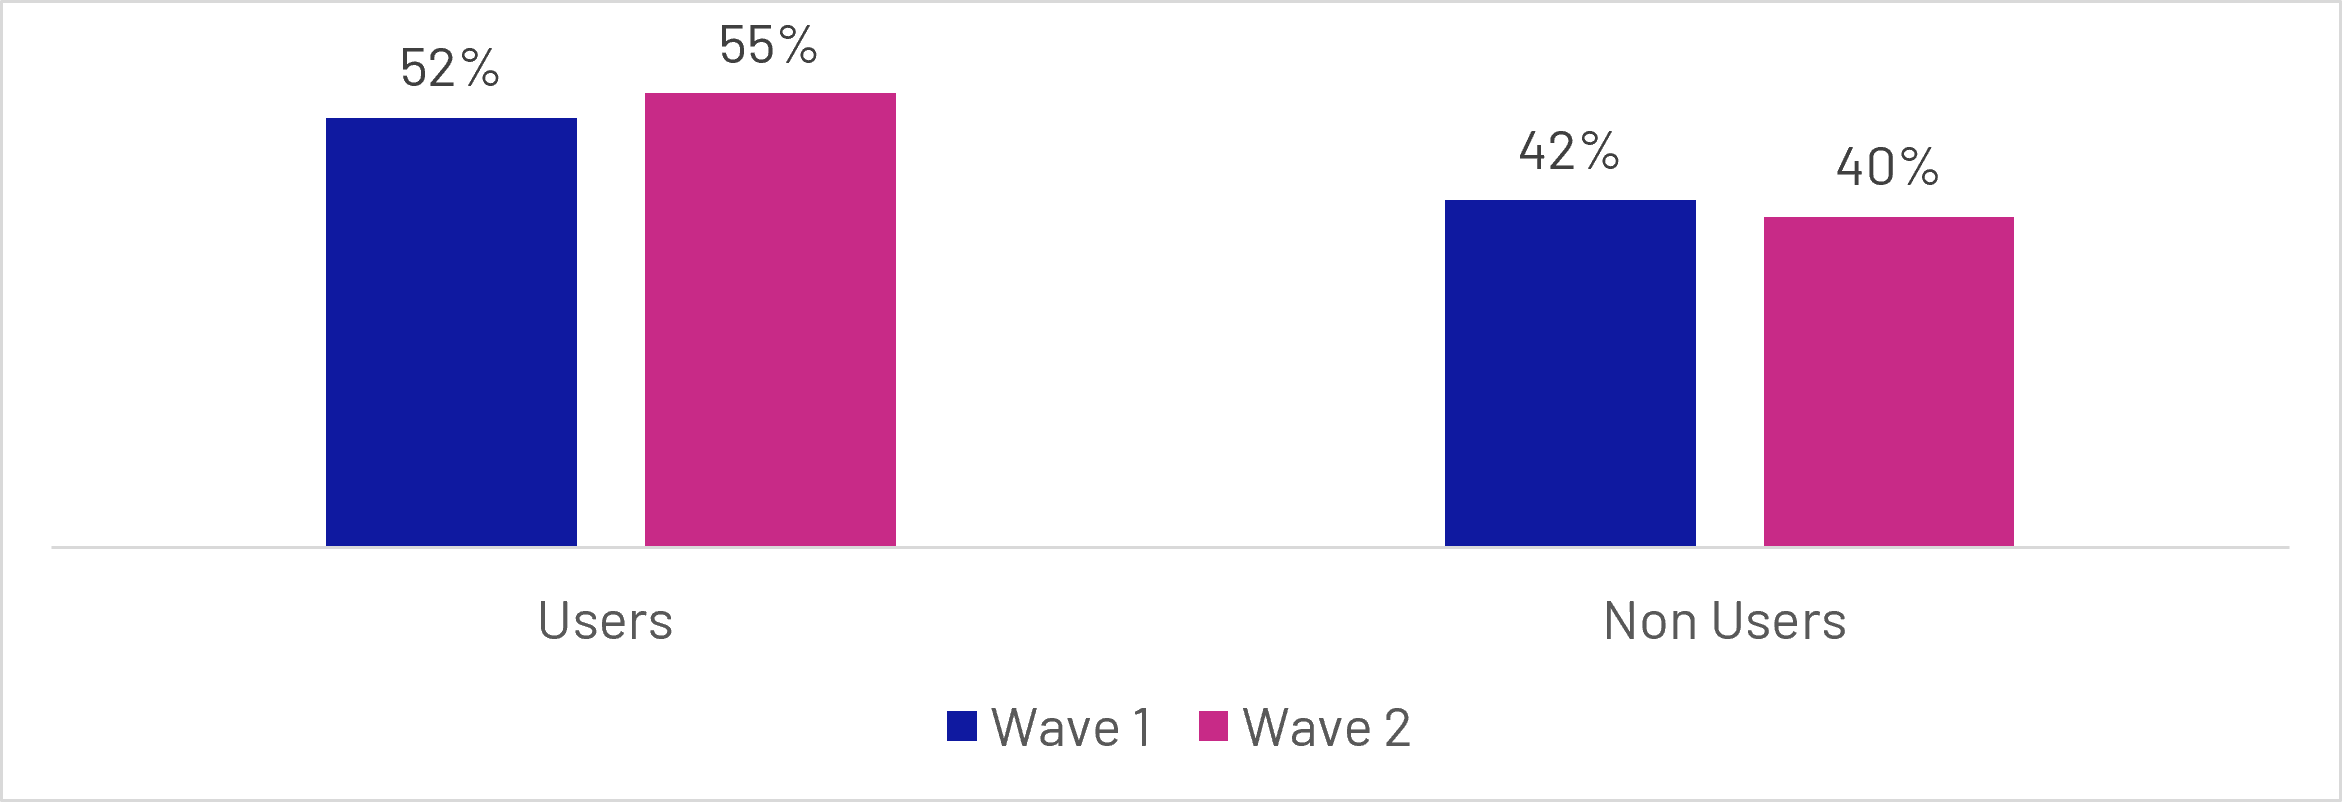
Figure 6.2: To what extent do you agree or disagree, if at all with: I understand enough about pensions to make decisions about saving for retirement? (Percentage of users and non-users that agreed or strongly agreed with the statement)
Base: All users (n=586 total unweighted), All non-users (n=1437 total unweighted)
Grouped bar chart comparing:
- Users: Wave 1 (52%), Wave 2 (55%)
- Non Users: Wave 1 (42%), Wave 2 (40%)
These patterns are supported by the results of qualitative research, where the dominant pattern was confirmation and consolidation rather than substantial new learning. Participants often already knew how many pensions they had, who their providers were and roughly what their pensions were worth; the dashboard’s main contribution was to bring this information together, verify that it matched their expectations and present it more clearly. This provided reassurance and sometimes improved confidence, even where little new was learned.
“I just learned that my pensions are still doing what they should be doing and it was a nice experience to know they were available to look at […] that I'm still doing the right thing.”
Female participant, Aged 35-44, MHPD User, Confused and Too Busy Segment
However, a smaller group gained more substantive insights, such as discovering or being reminded of a pension, seeing projected retirement income for the first time, or learning about employer contributions, tax, lump sums and investment risk. For some access to this information substantially increased their confidence around their pensions understanding.
“Before this dashboard, I probably would have rated myself about a 2 out of 10 in understanding, whereas now after all of that, I would probably put myself at a 7 […] I've learned the different things that you can do with them based upon your appetite for risk. I've also learned more about the tax implications. I learnt a bit more about the State Pension side of things as well.”
Female participant, Aged 35-44, MHPD User, Disengaged and Inactive Segment
6.3 Confidence
A consistent pattern across the survey is that those who went on to access the dashboard already demonstrated higher levels of confidence in managing and understanding their pensions at Wave 1. Across all measures, users reported greater confidence than non-users before accessing the dashboard. For example, 52% of eventual users felt confident about how to pay more into their pension(s), compared with 35% of non-users, while 52% were confident about the amount of their pension contributions, compared with 35% of non-users. Similar gaps were evident for more complex aspects of pension decision-making, including understanding tax-free lump sums (34% vs. 25%), determining whether pension contributions would be sufficient (31% vs. 23%), and identifying key pension features (34% vs. 23%). This suggests that dashboard users were, on average, already more engaged and knowledgeable about pensions than those who did not access the service.
Looking at the wider population, confidence improved modestly between baseline and follow-up. Among those not retired, net confidence in knowing how to pay more into a pension increased from +11 to +18 percentage points, while net confidence in knowing the exact amount of pension contributions increased from +10 to +14 percentage points.
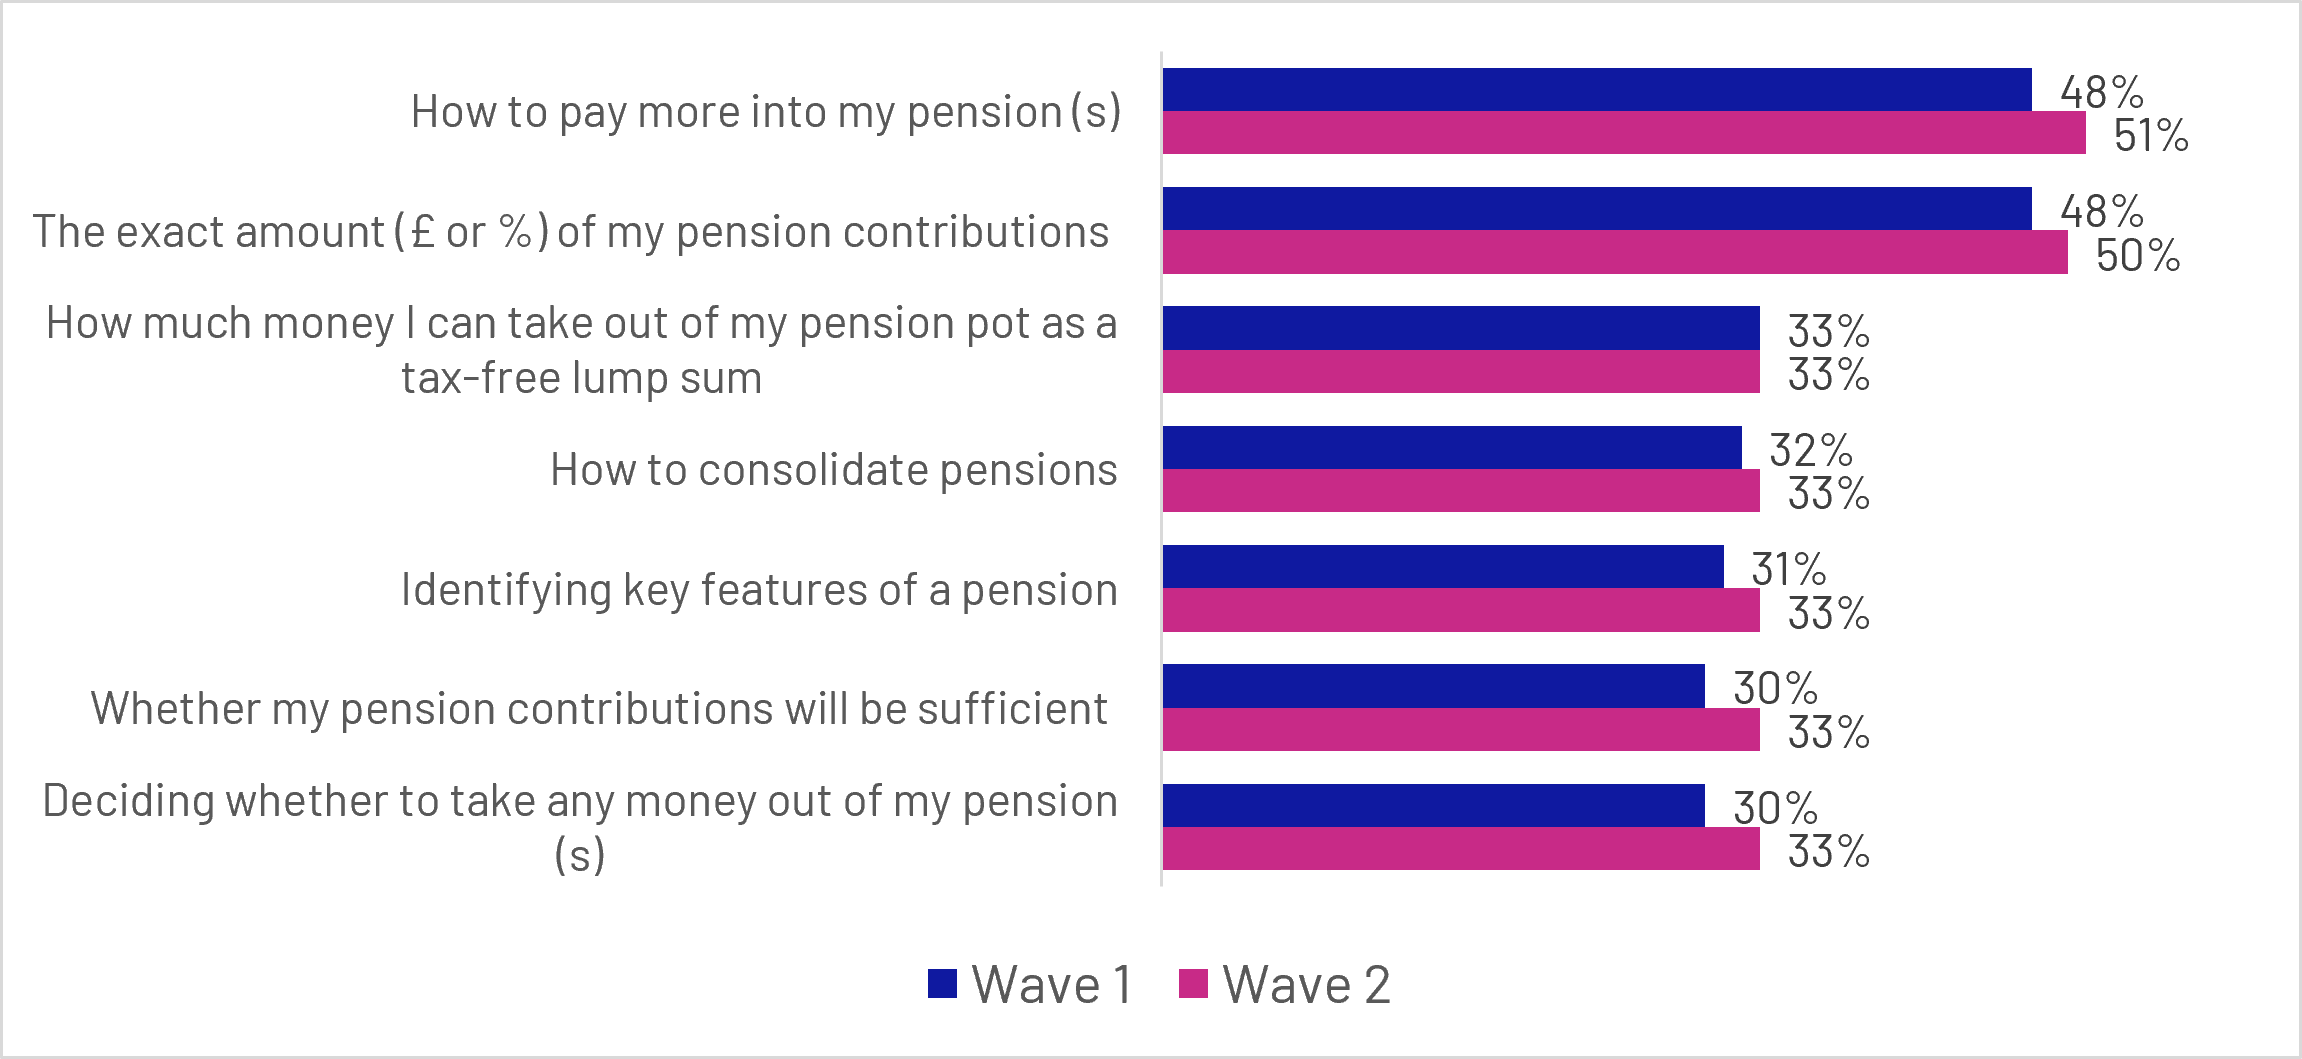
Figure 6.3: How confident, if at all, do you feel that you know enough about the following topics? (Percentage of respondents that said they were confident or very confident about each topic)
Base: All not retired or answering don’t know or prefer not to say (Wave 1 n = 2950, Wave 2 n = 1921)
Grouped bar chart:
- How to pay more into my pension(s): Wave 1 (48%), Wave 2 (51%)
- The exact amount (£ or %) of my pension contributions: Wave 1 (48%), Wave 2 (50%)
- How much money I can take out of my pension pot as a tax-free lump sum: Wave 1 (33%), Wave 2 (33%)
- How to consolidate pensions: Wave 1 (32%), Wave 2 (33%)
- Identifying key features of a pension: Wave 1 (31%), Wave 2 (33%)
- Whether my pension contributions will be sufficient: Wave 1 (30%), Wave 2 (33%)
- Deciding whether to take any money out of my pension(s): Wave 1 (30%), Wave 2 (33%)
Comparing non-users against users, confidence among dashboard users increased slightly across every measure tested. None of these increases were individually statistically significant, but the fact that confidence increased across all measures among dashboard users, suggests a consistent, but modest, positive pattern. The largest increases were seen in confidence regarding the exact amount of pension contributions (+5 percentage points), identifying key pension features (+5 points), how to pay more into a pension (+4 points), and whether current contributions would be sufficient (+4 points). Confidence in deciding whether to take money from a pension also increased by 4 points, while confidence in consolidating pensions rose by 3 points. In contrast, changes among non-users were generally smaller and less consistent. While some measures showed modest improvements, such as confidence in deciding whether to take money from a pension (+2 points) and how to pay more into a pension (+2 points), gains were typically around one to 2 percentage points. Confidence in understanding tax-free lump sums showed a slight decline (-1 point).
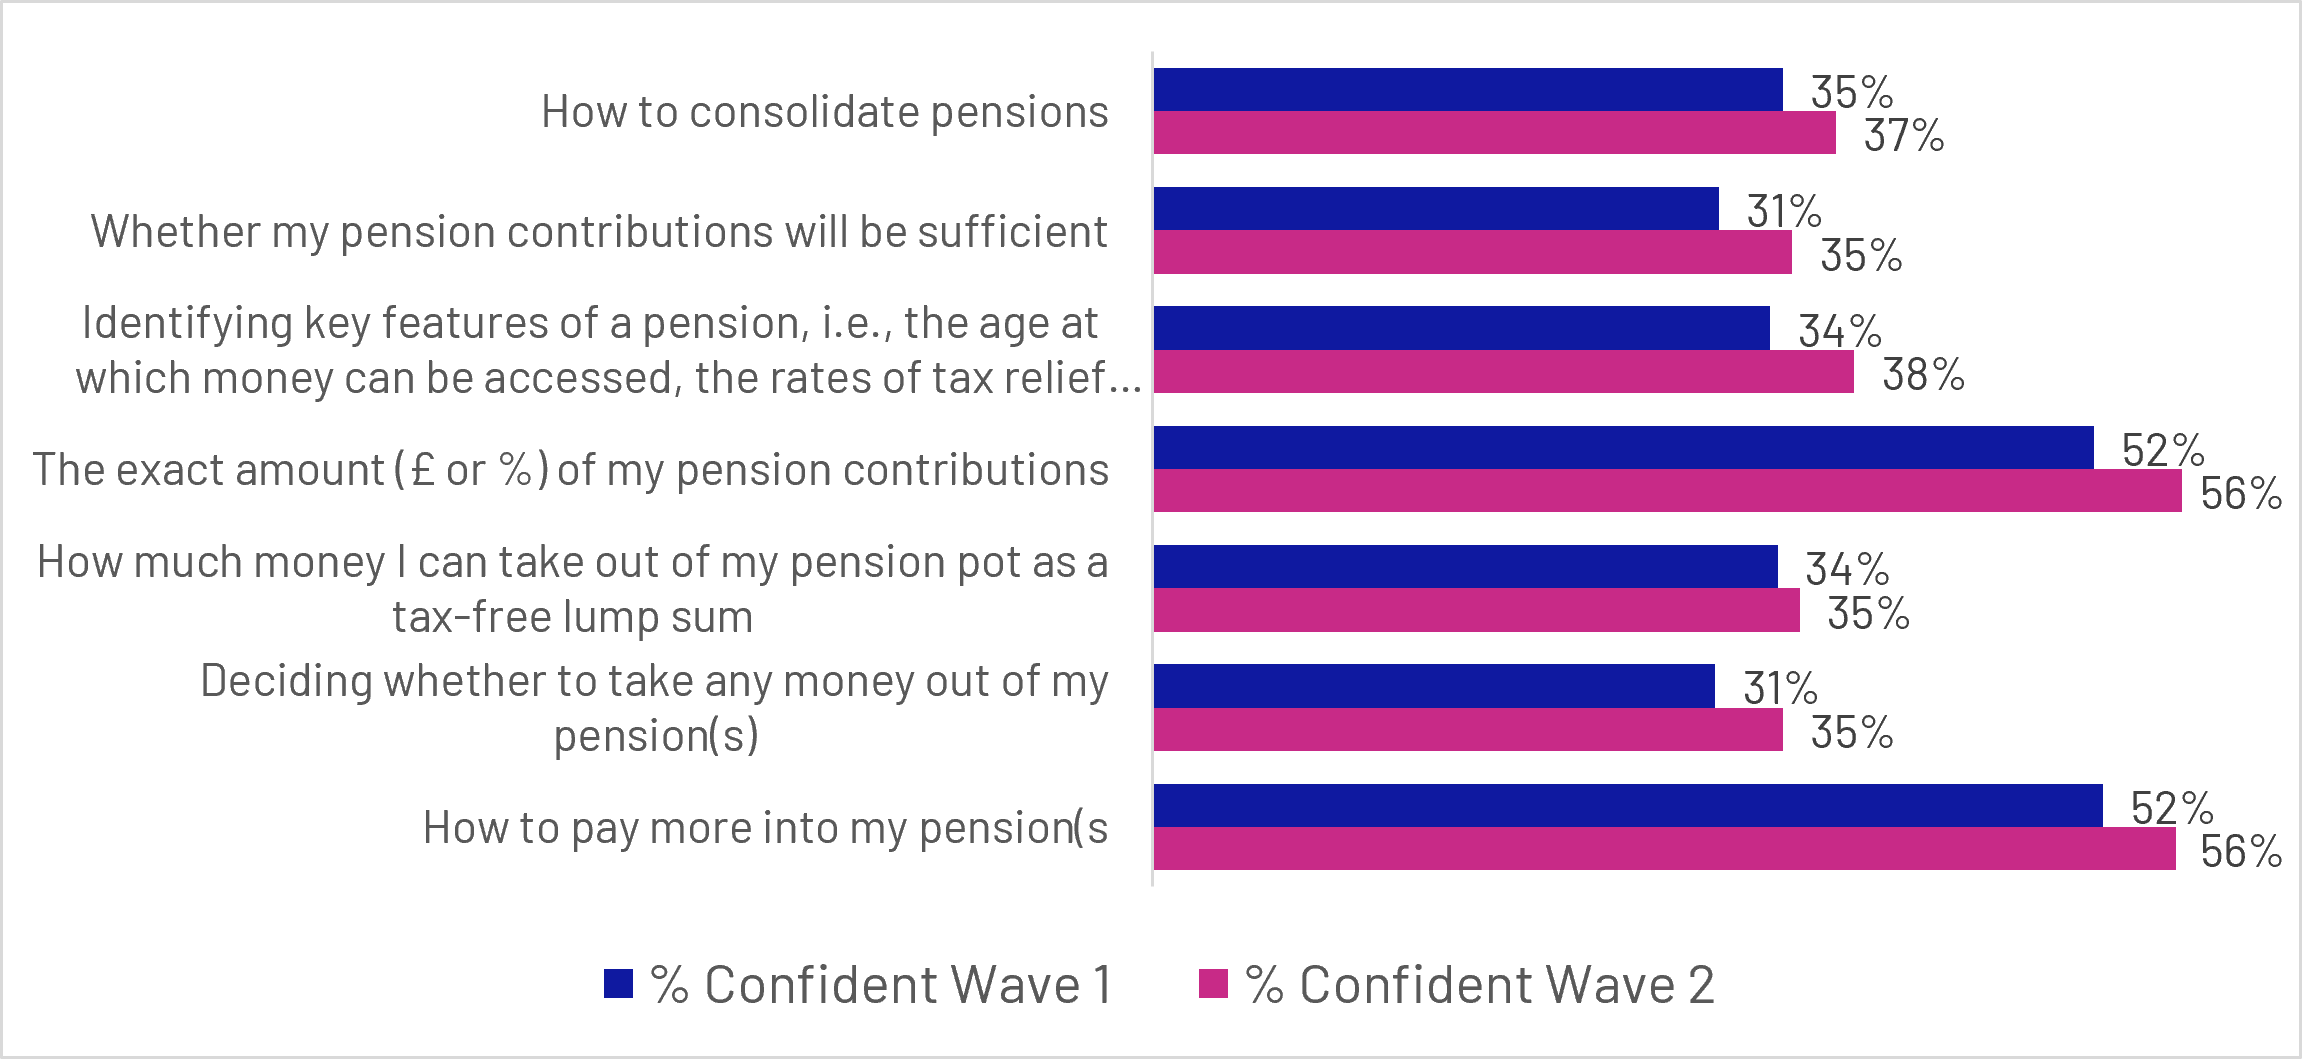
Figure 6.4: How confident, if at all, do you feel that you know enough about the following topics? (Percentage of dashboard users that said they were confident or very confident about each topic)
Base: All Users (n=595 unweighted total)
Grouped bar chart:
- How to consolidate pensions: Wave 1 (35%), Wave 2 (37%)
- Whether my pension contributions will be sufficient: Wave 1 (31%), Wave 2 (35%)
- Identifying key features of a pension, i.e., the age at which money can be accessed, the rates of tax relief...: Wave 1 (34%), Wave 2 (38%)
- The exact amount (£ or %) of my pension contributions: Wave 1 (52%), Wave 2 (56%)
- How much money I can take out of my pension pot as a tax-free lump sum: Wave 1 (34%), Wave 2 (35%)
- Deciding whether to take any money out of my pension(s): Wave 1 (31%), Wave 2 (35%)
- How to pay more into my pension(s): Wave 1 (52%), Wave 2 (56%)
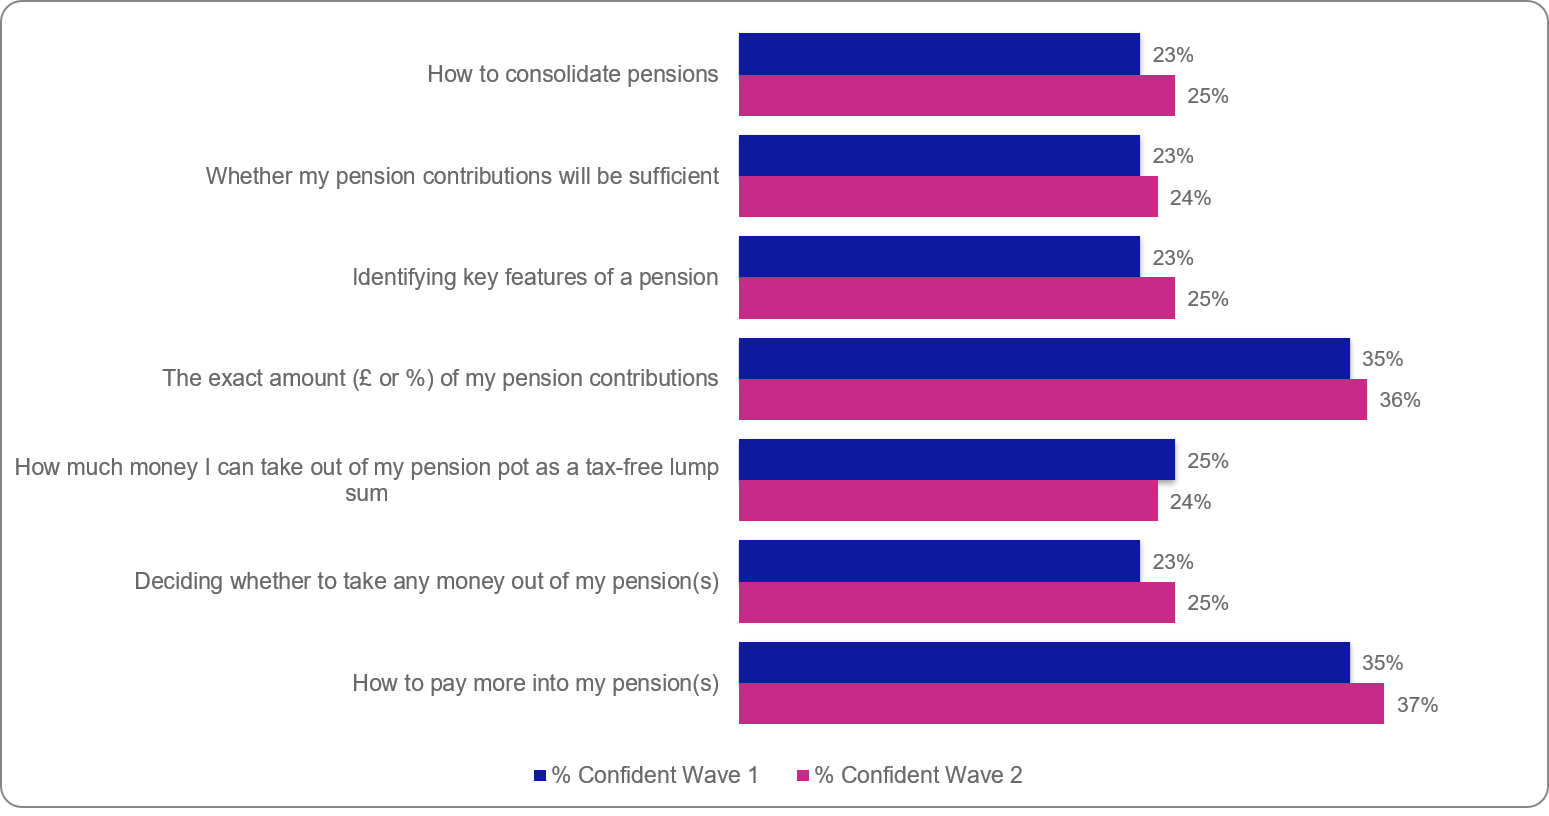
Figure 6.5: How confident, if at all, do you feel that you know enough about the following topics? (Percentage of dashboard non-users that said they were confident or very confident about each topic)
Base: All non-Users (n = 1447 unweighted)
Grouped bar chart:
- How to consolidate pensions: Wave 1 (23%), Wave 2 (25%)
- Whether my pension contributions will be sufficient: Wave 1 (23%), Wave 2 (24%)
- Identifying key features of a pension: Wave 1 (23%), Wave 2 (25%)
- The exact amount (£ or %) of my pension contributions: Wave 1 (35%), Wave 2 (36%)
- How much money I can take out of my pension pot as a tax-free lump sum: Wave 1 (25%), Wave 2 (24%)
- Deciding whether to take any money out of my pension(s): Wave 1 (23%), Wave 2 (25%)
- How to pay more into my pension(s): Wave 1 (35%), Wave 2 (37%)
The qualitative research suggests that, while the dashboard did not substantially increase pension knowledge for most participants, it had a more noticeable impact on confidence. Bringing pension information together, confirming that arrangements were as expected and presenting values or projected income more clearly gave participants greater reassurance about their position. For some, this made their retirement finances feel more tangible and manageable, even where their underlying understanding had changed little. However, confidence was less likely to improve among those who already managed their pensions actively or where dashboard information was incomplete.
“I think it's a very useful tool. It's quite good to have all that information at your fingertips. It confirmed to me that sort of everything I was doing was on the right track.”
Male participant, Aged 25-34, MHPD User, Confident and Proactive
Many participants described feeling reassured, relieved or more confident after viewing their results, particularly where the dashboard confirmed pension values they expected to see or brought together information that had previously been fragmented across multiple providers. This reduction in uncertainty was often described as being just as valuable as gaining new information.
“I think it'll definitely help me feel more confident to manage my pensions as a whole. It will make it much easier to be able to see them all in one place.”
Female participant, Aged 35-44, MHPD User, Confident and Proactive
However, not all reactions were positive. For a minority, seeing projected retirement income or pension values highlighted a gap between their expectations and likely retirement outcomes, reducing rather than increasing confidence. As explored in the following section, both reassurance and concern could prompt participants to reflect more actively on their retirement plans.
6.4 Retirement planning
At the time of the Wave 2 survey, there was limited evidence that the dashboard had influenced retirement planning behaviours, although the findings indicated a more positive effect on pension engagement. Prior to dashboard access, 64% of future users said they had either a clear or rough plan for their retirement finances, compared with 51% of non-users, suggesting that those who chose to use the dashboard were already more engaged with retirement planning.
Planning levels changed little between waves. Among dashboard users, the proportion reporting a clear or rough retirement plan increased slightly from 64% to 65%, while the equivalent figure among non-users remained broadly unchanged (51% at Wave 1 and 51% at Wave 2). Although some users moved from having no retirement plan to having at least a rough plan, similar patterns were also observed among non-users.
Taken together, these findings provide limited evidence that dashboard use had a substantial impact on retirement planning over the study period. Rather, the results suggest that dashboard users were already more engaged in retirement planning before accessing the service. While the dashboard may have reinforced this engagement for some users, changes in planning behaviour were modest and comparable to those observed among non-users.
However, broader attitudinal measures point towards improved engagement. Across the full sample, agreement that respondents knew roughly how much their pensions were worth increased between baseline and Wave 2, while fewer people agreed that they did not know where to start when planning for retirement.
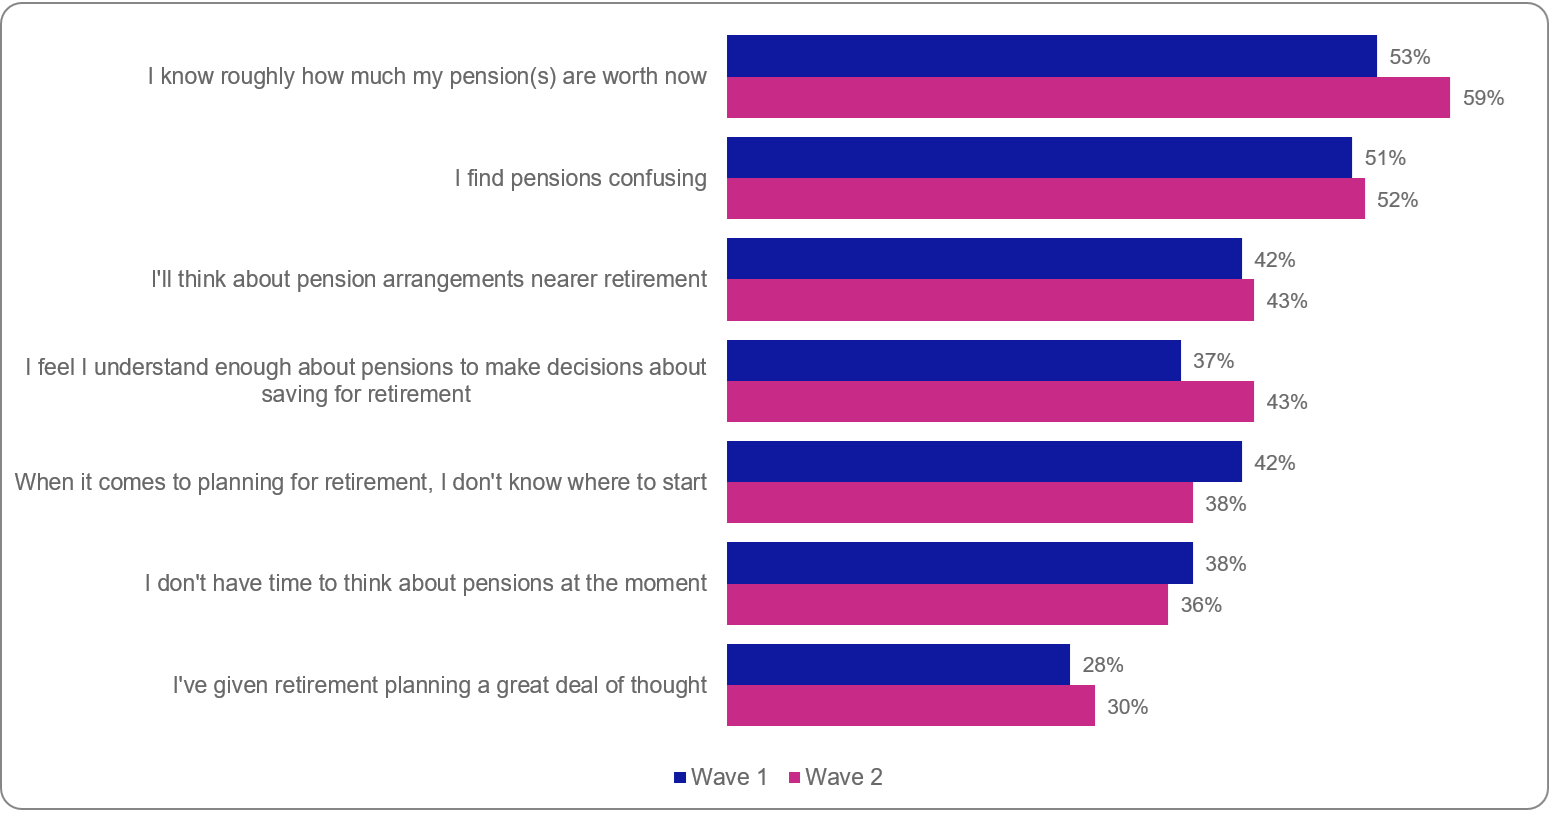
Figure 6.6: Q14: To what extent do you agree, if at all, with the following statements? (Percentage of dashboard users agreeing or strongly agreeing with each topic)
Base: All but retired and those answering prefer not to say (Wave 1 n = 2950, Wave 2 n = 1921)
Grouped bar chart:
- I know roughly how much my pension(s) are worth now: Wave 1 (53%), Wave 2 (59%)
- I find pensions confusing: Wave 1 (51%), Wave 2 (52%)
- I'll think about pension arrangements nearer retirement: Wave 1 (42%), Wave 2 (43%)
- I feel I understand enough about pensions to make decisions about saving for retirement: Wave 1 (37%), Wave 2 (43%)
- When it comes to planning for retirement, I don't know where to start: Wave 1 (42%), Wave 2 (38%)
- I don't have time to think about pensions at the moment: Wave 1 (38%), Wave 2 (36%)
- I've given retirement planning a great deal of thought: Wave 1 (28%), Wave 2 (30%)
Comparing users and non-users suggests that access to the dashboard may be associated with these changes between waves. While dashboard users already reported higher levels of pensions knowledge, confidence and engagement at baseline, the magnitude of change was generally greater among users than among non-users. The clearest differences were observed in understanding of pension values and retirement planning, where agreement that respondents knew roughly how much their pensions were worth increased by 12 percentage points among users, compared with 3 percentage points among non-users. Similarly, using the broader attitudinal measure included within Q14, agreement that respondents understood enough about pensions to make decisions about saving for retirement increased by 10 percentage points among users, compared with 2 percentage points among non-users.
The attitudinal measures also point towards a more positive shift among dashboard users. Agreement that respondents did not have time to think about pensions fell by 5 percentage points among users while remaining unchanged among non-users. Similarly, agreement that they did not know where to start when planning for retirement fell by 9 percentage points among users, compared with a 2-percentage-point decline among non-users.
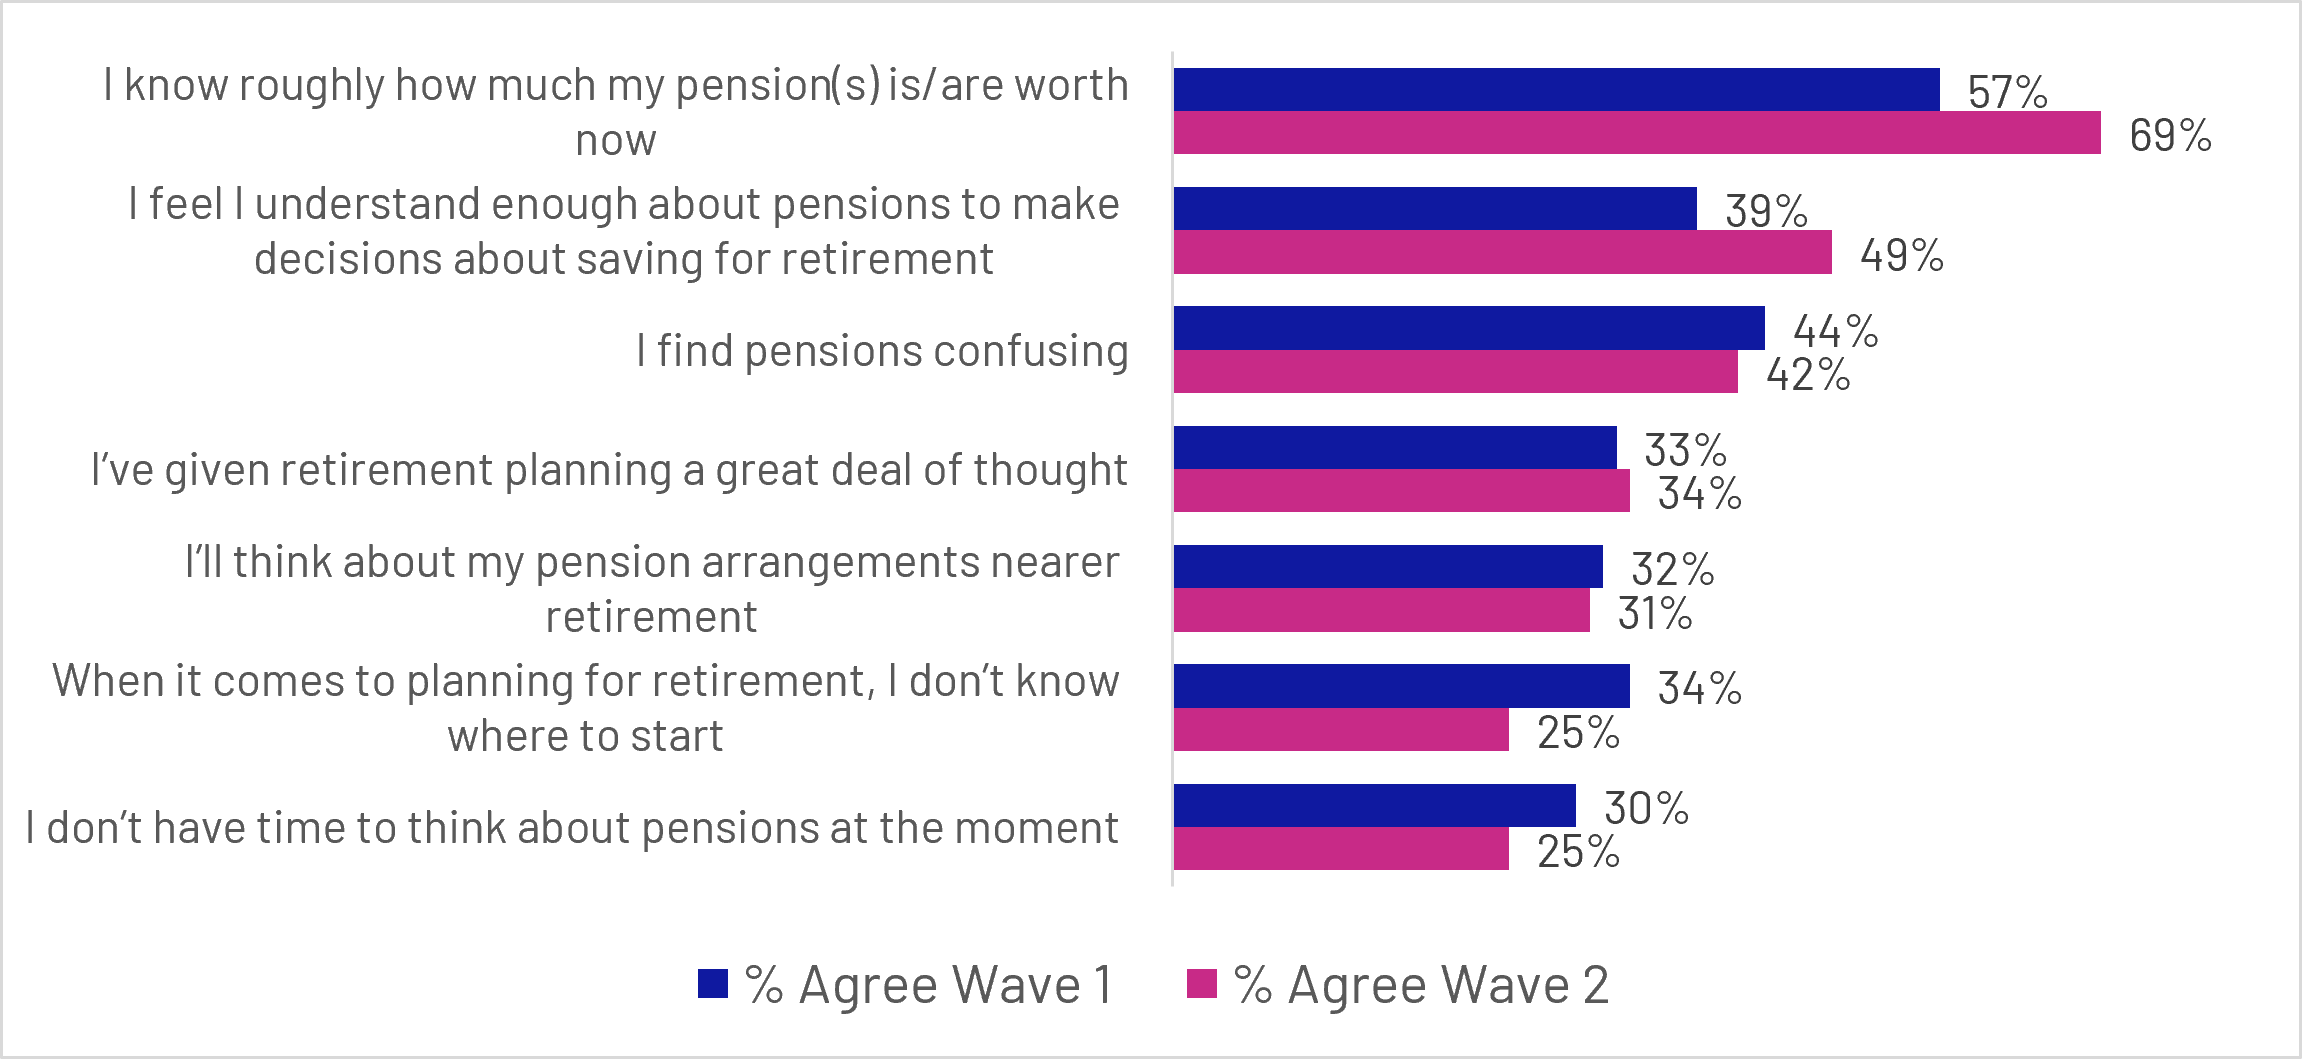
Figure 6.7: Q14: To what extent do you agree, if at all, with the following statements? (Users only)
Base: All Users (n=595 unweighted total)
Grouped bar chart:
- I know roughly how much my pension(s) is/are worth now: Wave 1 (57%), Wave 2 (69%)
- I feel I understand enough about pensions to make decisions about saving for retirement: Wave 1 (39%), Wave 2 (49%)
- I find pensions confusing: Wave 1 (44%), Wave 2 (42%)
- I’ve given retirement planning a great deal of thought: Wave 1 (33%), Wave 2 (34%)
- I’ll think about my pension arrangements nearer retirement: Wave 1 (32%), Wave 2 (31%)
- When it comes to planning for retirement, I don’t know where to start: Wave 1 (34%), Wave 2 (25%)
- I don’t have time to think about pensions at the moment: Wave 1 (30%), Wave 2 (25%)
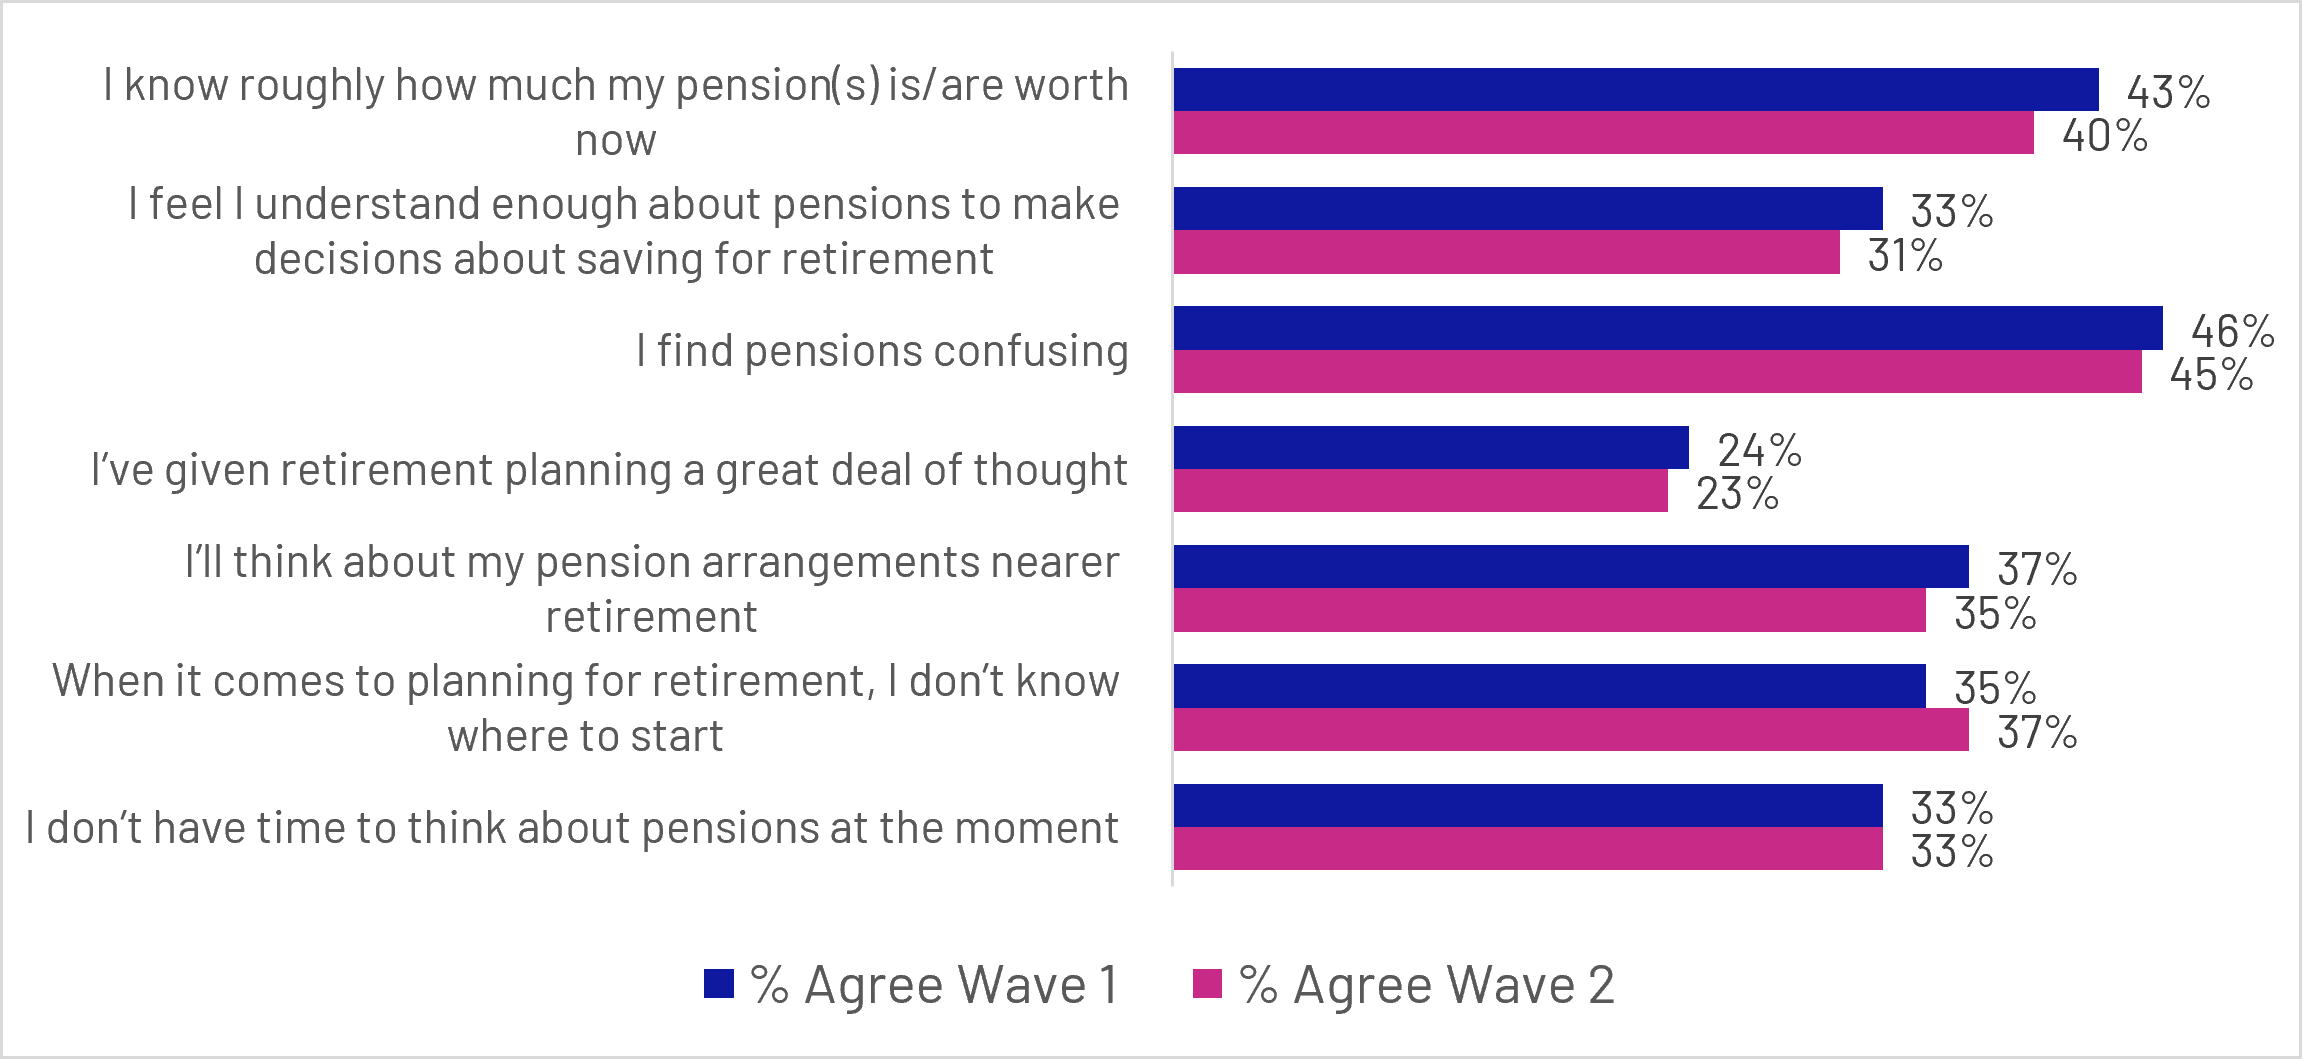
Figure 6.8: Q14: To what extent do you agree, if at all, with the following statements? (Non-users only)
Base: All Non-users (n=1447 unweighted total)
Grouped bar chart:
- I know roughly how much my pension(s) is/are worth now: Wave 1 (43%), Wave 2 (40%)
- I feel I understand enough about pensions to make decisions about saving for retirement: Wave 1 (33%), Wave 2 (31%)
- I find pensions confusing: Wave 1 (46%), Wave 2 (45%)
- I’ve given retirement planning a great deal of thought: Wave 1 (24%), Wave 2 (23%)
- I’ll think about my pension arrangements nearer retirement: Wave 1 (37%), Wave 2 (35%)
- When it comes to planning for retirement, I don’t know where to start: Wave 1 (35%), Wave 2 (37%)
- I don’t have time to think about pensions at the moment: Wave 1 (33%), Wave 2 (33%)
Taken together, these findings suggest that dashboard use may have helped users feel more informed, engaged and better equipped to think about retirement planning. While the evidence does not point to a dramatic change in retirement planning behaviour itself, it is consistent with the dashboard helping users build a clearer understanding of their pension situation and increasing confidence in managing their retirement savings.
The qualitative research suggests that the dashboard’s impact on retirement planning was generally modest but positive. As discussed in the previous section, seeing pension information brought together could provide reassurance or reveal that participants were less prepared than expected. Both responses could act as a starting point for greater engagement with retirement planning, although they did not usually result in immediate action.
For participants who felt reassured by what they saw, the dashboard helped confirm that they were broadly on track and made continued planning feel more achievable. Seeing their pensions together and understanding what their savings might provide in retirement encouraged some to monitor their position more regularly and consider whether they should take further action.
“I'd probably say the dashboard made me feel optimistic that my pensions are moving in the right direction. So if I keep going as I am, then each month is a bit extra to just keep planning and prepping [..] I feel like I would definitely check it on a more regular basis than I have done previously.”
Female participant, Aged 25-34, MHPD User, Disengaged and Inactive Segment
“It's reassuring, that's what it is for me [...] I know I'm going to be able to afford to live, I know I'm going to be able to afford to pay bills.”
Male participant, Aged 45-54, MHPD User, Confident and Proactive Segment
For others, the dashboard prompted more active reflection by highlighting a potential gap between their expected and desired retirement outcomes. Although this could initially reduce confidence or cause concern, it also helped make the need to plan more immediate. These participants began to reassess whether they were saving enough and consider possible responses, including increasing contributions, reviewing their intended retirement age or seeking financial advice.
“I thought I had a plan, but after looking at that MoneyHelper Dashboard, I'm kind of thinking the plans that I did have are not going to be anywhere near what I would need for the lifestyle that I want at retirement age. So that's definitely got me thinking that I need to change something.”
Female participant, Aged 35-44, MHPD User, Disengaged and Inactive Segment
Overall, the dashboard’s main contribution at this stage was therefore to support reflection and strengthen intentions, rather than directly prompt widespread changes in behaviour.
Back to top7. From dashboard use to action
This section explores the actions users have already taken as a result of accessing the dashboard, the actions they intend to take in future, and the extent to which users understand what to do when presented with pensions requiring further attention.
7.1 Key quantitative findings
The dashboard's primary early impact appears to be increasing engagement with pensions rather than driving immediate financial decisions. More than half of users reported taking action after using the dashboard and a similar proportion intended to take further action in the future. These actions were most often focused on reviewing pension information, seeking further guidance and reflecting on retirement planning, indicating that the dashboard helps move users from passive awareness towards more active engagement with their retirement finances.
7.2 Actions already taken
For many users, accessing the dashboard led to further engagement with their pensions and retirement planning. More than half of users (56%) reported taking at least one action as a direct result of accessing the dashboard, while 42% said they had not yet taken any action.
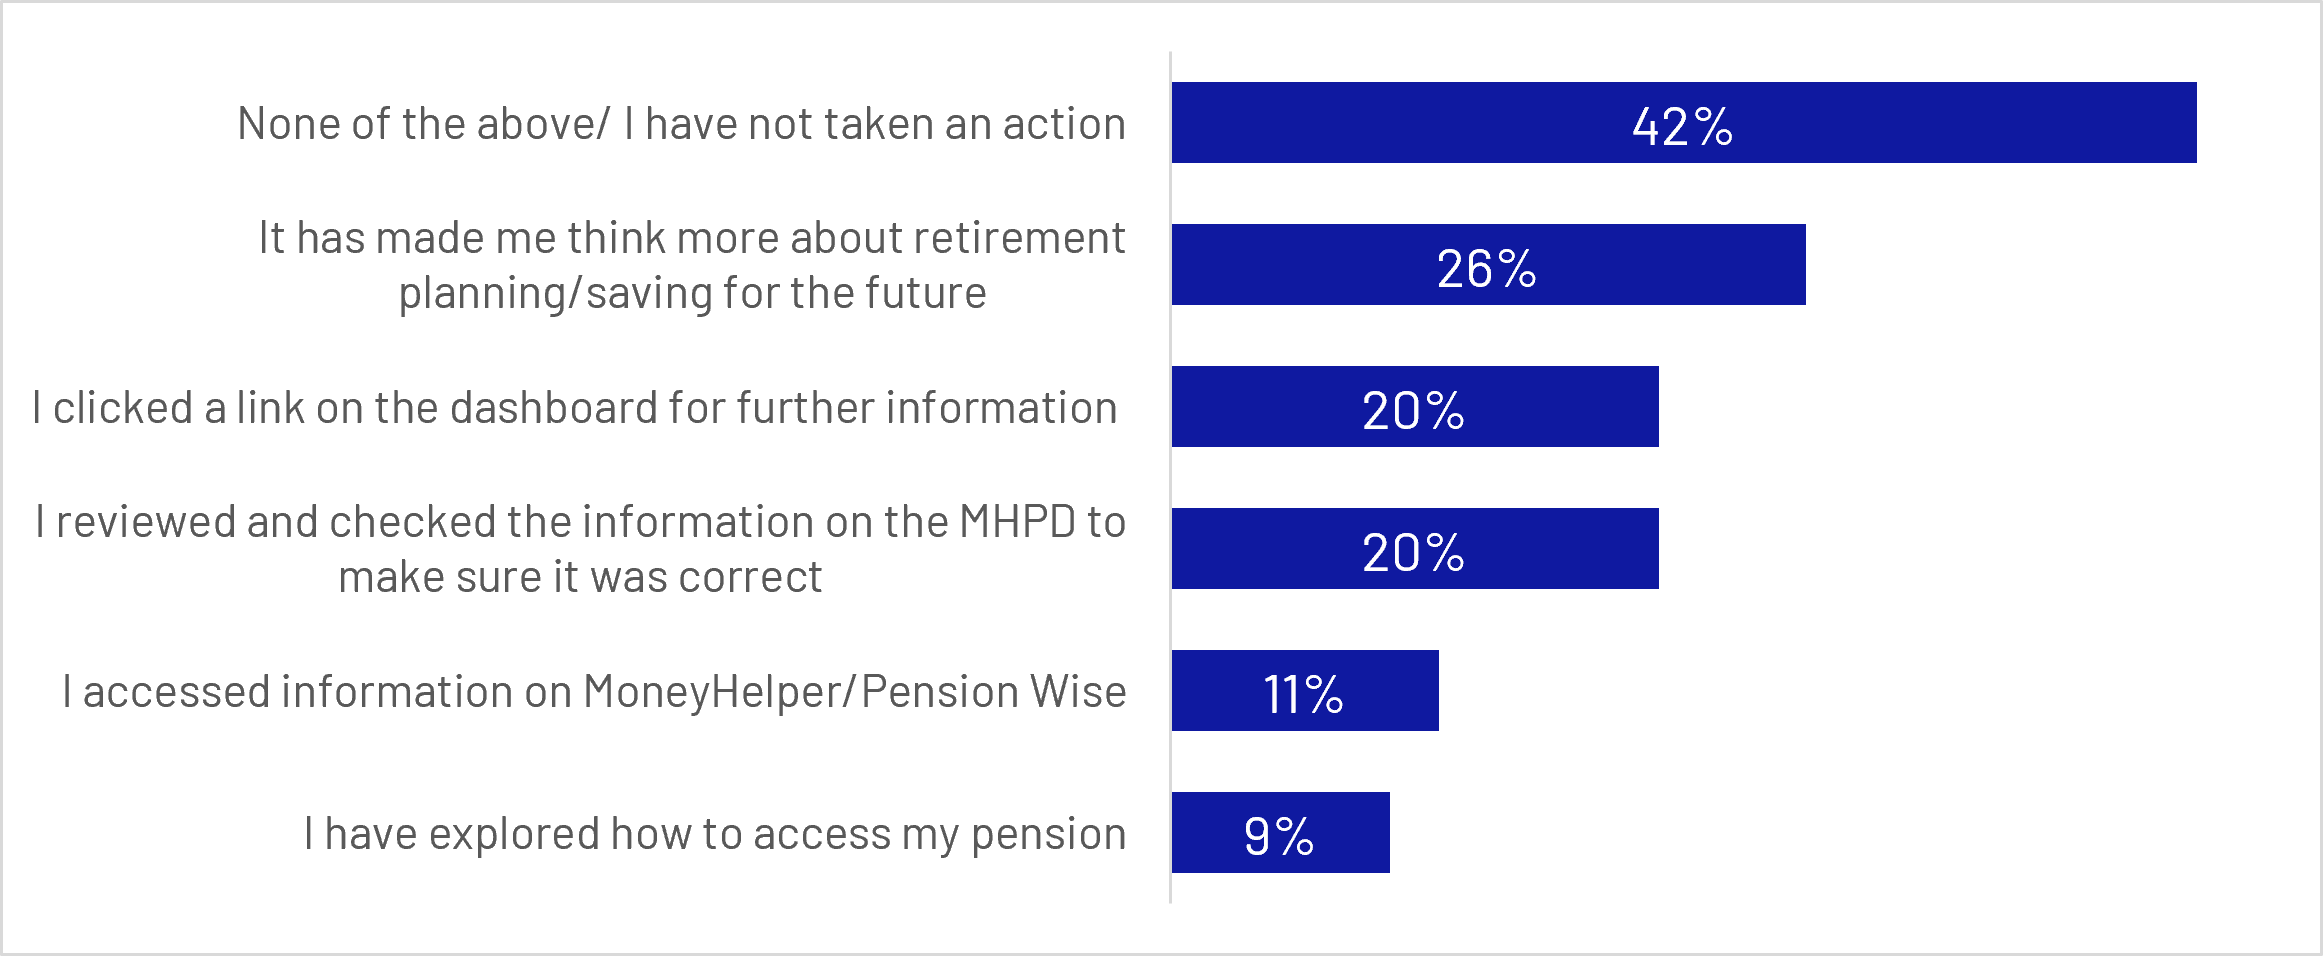
Figure 7.1: Q31: As a result of accessing the MHPD, which of the following actions, if any, did you do? (Top 5 actions taken)
Base: All who have accessed MHPD since Wave 1 survey (n=595 unweighted)
Bar chart:
- None of the above/ I have not taken an action: 42%
- It has made me think more about retirement planning/saving for the future: 26%
- I clicked a link on the dashboard for further information: 20%
- I reviewed and checked the information on the MHPD to make sure it was correct: 20%
- I accessed information on MoneyHelper/Pension Wise: 11%
- I have explored how to access my pension: 9%
7.3 Most common actions
The most commonly reported outcome was increased reflection on retirement planning, with 26% saying that the dashboard had prompted them to think more about retirement planning or saving for the future. One in 5 users (20%) clicked on links within the dashboard to access further information, and an equal proportion (20%) reviewed the information displayed on the dashboard to check that it was accurate and up to date. These findings suggest that, for many users, the immediate impact of dashboard use was to encourage greater engagement with retirement planning rather than to trigger major financial decisions.
Other actions were less common but still demonstrate evidence of continued engagement. Around one in 10 users accessed information from MoneyHelper or Pension Wise (11%), while 9% explored how to access their pension and 8% sought additional information from other sources, such as pension providers or online resources. Smaller proportions contacted pension providers, updated personal details, explored pension tracing services, or began considering pension consolidation.
These findings indicate that dashboard use most often acts as a catalyst for information-seeking and reflection, helping users take initial steps towards better understanding and managing their retirement savings.
During qualitative research it was atypical for participants to report substantial concrete actions as a result of accessing the dashboard. The most common outcome of using the dashboard was validation and reassurance rather than concrete action or behaviour change. However, the dashboard sometimes acted as a prompt for information-seeking or reflective actions.
This typically occurred when the dashboard highlighted information that participants felt required further investigation, such as missing pension records, previously forgotten pension pots or pension values that differed from expectations. In response, participants typically logged into existing pension accounts to check or validate information, while a small number were prompted to updated details such as addresses or pension nominees.
“It's prompted me to check that everything's up to date, but I don't think I've had the need to change anything.”
Female participant, Aged 35-44, MHPD User, Confident and Proactive Segment
For some participants viewing their pension information prompted them to explore additional resources, including pension provider websites, educational content and guidance materials. This suggests that the dashboard can act as a gateway to wider engagement, encouraging some users to build their understanding of pensions, retirement planning and related financial topics beyond the information presented on the dashboard itself.
“I went onto the teacher pension website to look at how their pension actually works and tried to work that out. I watched a couple of videos on YouTube as well. And then I explored some of the articles on the Money and Pensions Service as well […] mainly on starting investing in things, not necessarily using a pension, but using things like stocks and shares, and how to start with those.”
Male participant, Aged 18-24, MHPD User, Confused and Concerned Segment
For a small minority of participants, the dashboard prompted direct engagement with pension providers. This most commonly occurred when users were alerted to potential historical pension entitlements or information that required further investigation. Participants reported that the contact details and reference numbers provided by the dashboard made it straightforward to follow up with providers and investigate whether additional pension pots existed. In these cases, the dashboard did not simply increase awareness, but helped users take concrete steps to verify and manage their pension information.
“It did bring up a couple of pensions that they thought I may have had in the past and it gave me links to those to contact the pension providers. So it was actually quite useful.”
Female participant, Aged 55-64, MHPD User, Confused and Too busy Segment
Separately, bringing pension information together in one place prompted a small number of participants, typically those who realised their current plans might not meet their expectations around retirement finances, to reflect more deeply on their retirement planning and financial preparedness. However, this commonly resulted in the formation of future intentions rather than immediate behavioural change or action.
7.4 Intended future actions
In addition to actions already taken, many users reported intending to take further steps in the future. Around 57% stated that there was at least one action they planned to undertake as a result of accessing the dashboard. The most commonly cited intentions were reviewing dashboard information to check its accuracy (14%), accessing information or guidance from MoneyHelper or Pension Wise (12%), and thinking more about retirement planning and saving for the future (11%).
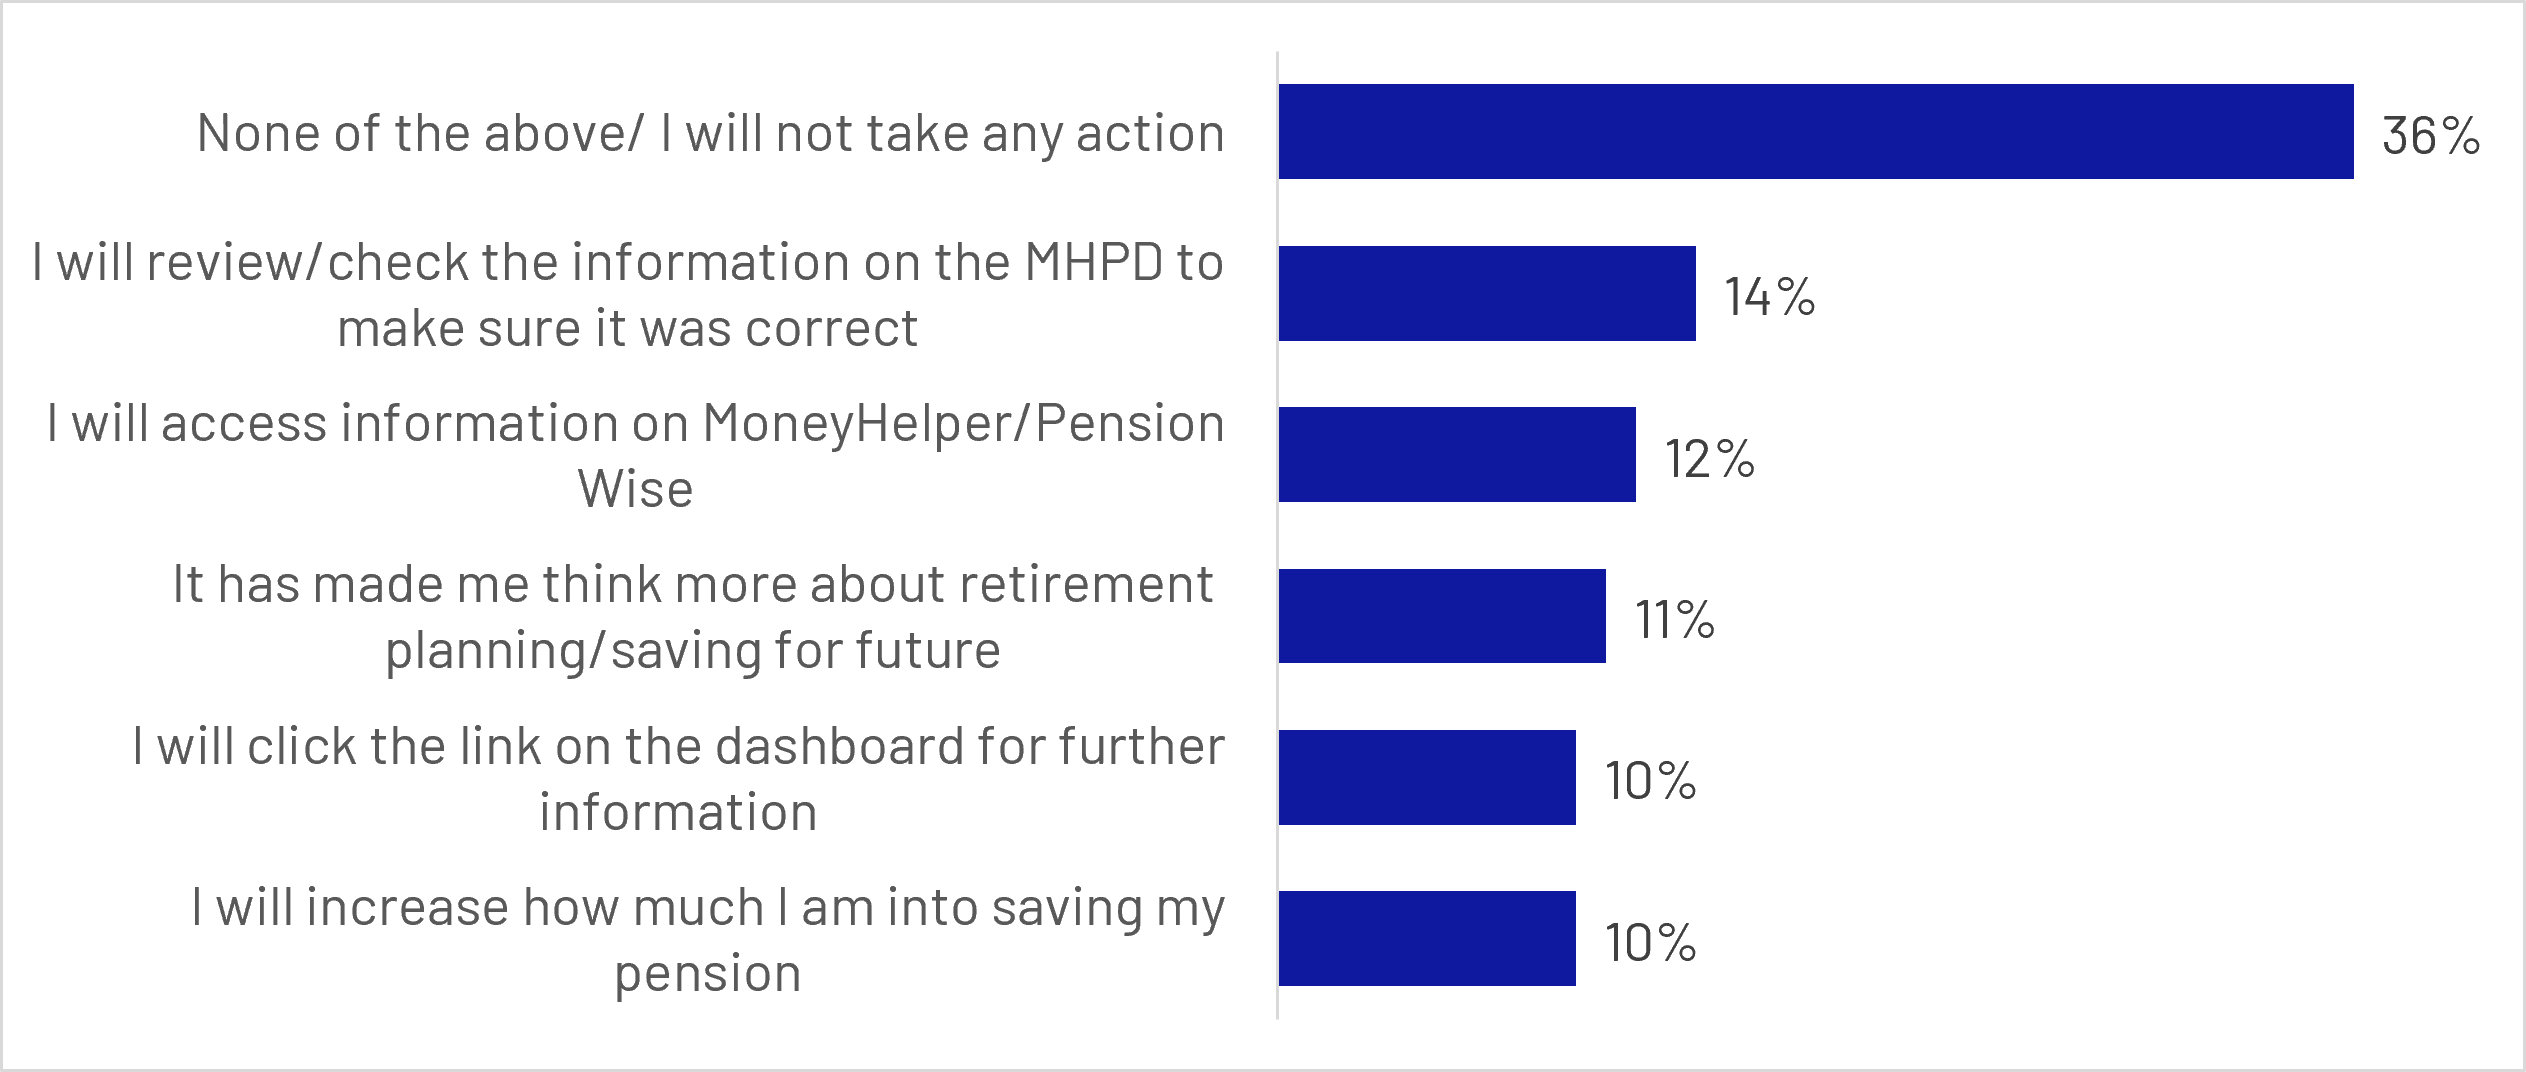
Figure 7.2: Q32: And of those actions you have not yet done, which do you plan to do?
Base: All who have accessed MHPD since Wave 1 survey (Q20) (n=595 unweighted)
Bar chart:
- None of the above/ I will not take any action: 36%
- I will review/ check the information on the MHPD to make sure it was correct: 14%
- I will access information on MoneyHelper/Pension Wise: 12%
- It has made me think more about retirement planning/saving for future: 11%
- I will click the link on the dashboard for further information: 10%
- I will increase how much I am into saving my pension: 10%
A smaller proportion intended to click through for additional information (10%), increase pension contributions (10%), seek regulated financial advice (9%), or begin consolidating pensions (8%). These intentions suggest that for some users, the dashboard may represent the start of a longer engagement journey rather than an immediate trigger for action.
Nevertheless, a sizeable minority remained disengaged after use. More than a third (36%) reported that they did not intend to take any further action, indicating that while the dashboard can act as a prompt for many users, it does not necessarily translate into behavioural change for everyone.
The qualitative research supports the conclusion that these intended actions often reflected the early stages of engagement rather than firm plans. Participants commonly described wanting to revisit the dashboard, check pension information more regularly, learn more about retirement planning, or considered future actions such as pension consolidation and increasing contributions. While relatively few participants had taken substantial action immediately following use, the dashboard did regularly prompt reflection and, sometimes the formation of future intentions, indicating that its impact may emerge gradually over time rather than through immediate behaviour change.
“Accessing it has made me think maybe I do need to put a little bit more away […] I don't feel the need to kind of start planning that straight away, but in the near future maybe I need to just think about boosting it a little bit.”
Female participant, Aged 35-44, MHPD User, Confident and Proactive Segment
7.5 Pensions requiring action and support needs
Most users (75%) did not encounter any pensions within the dashboard's "pensions that need action" section. However, 16% reported seeing one or more pensions requiring further attention. Among this group, two thirds (66%) said they understood what they needed to do next, but more than a quarter (28%) reported that they did not know what action was required.
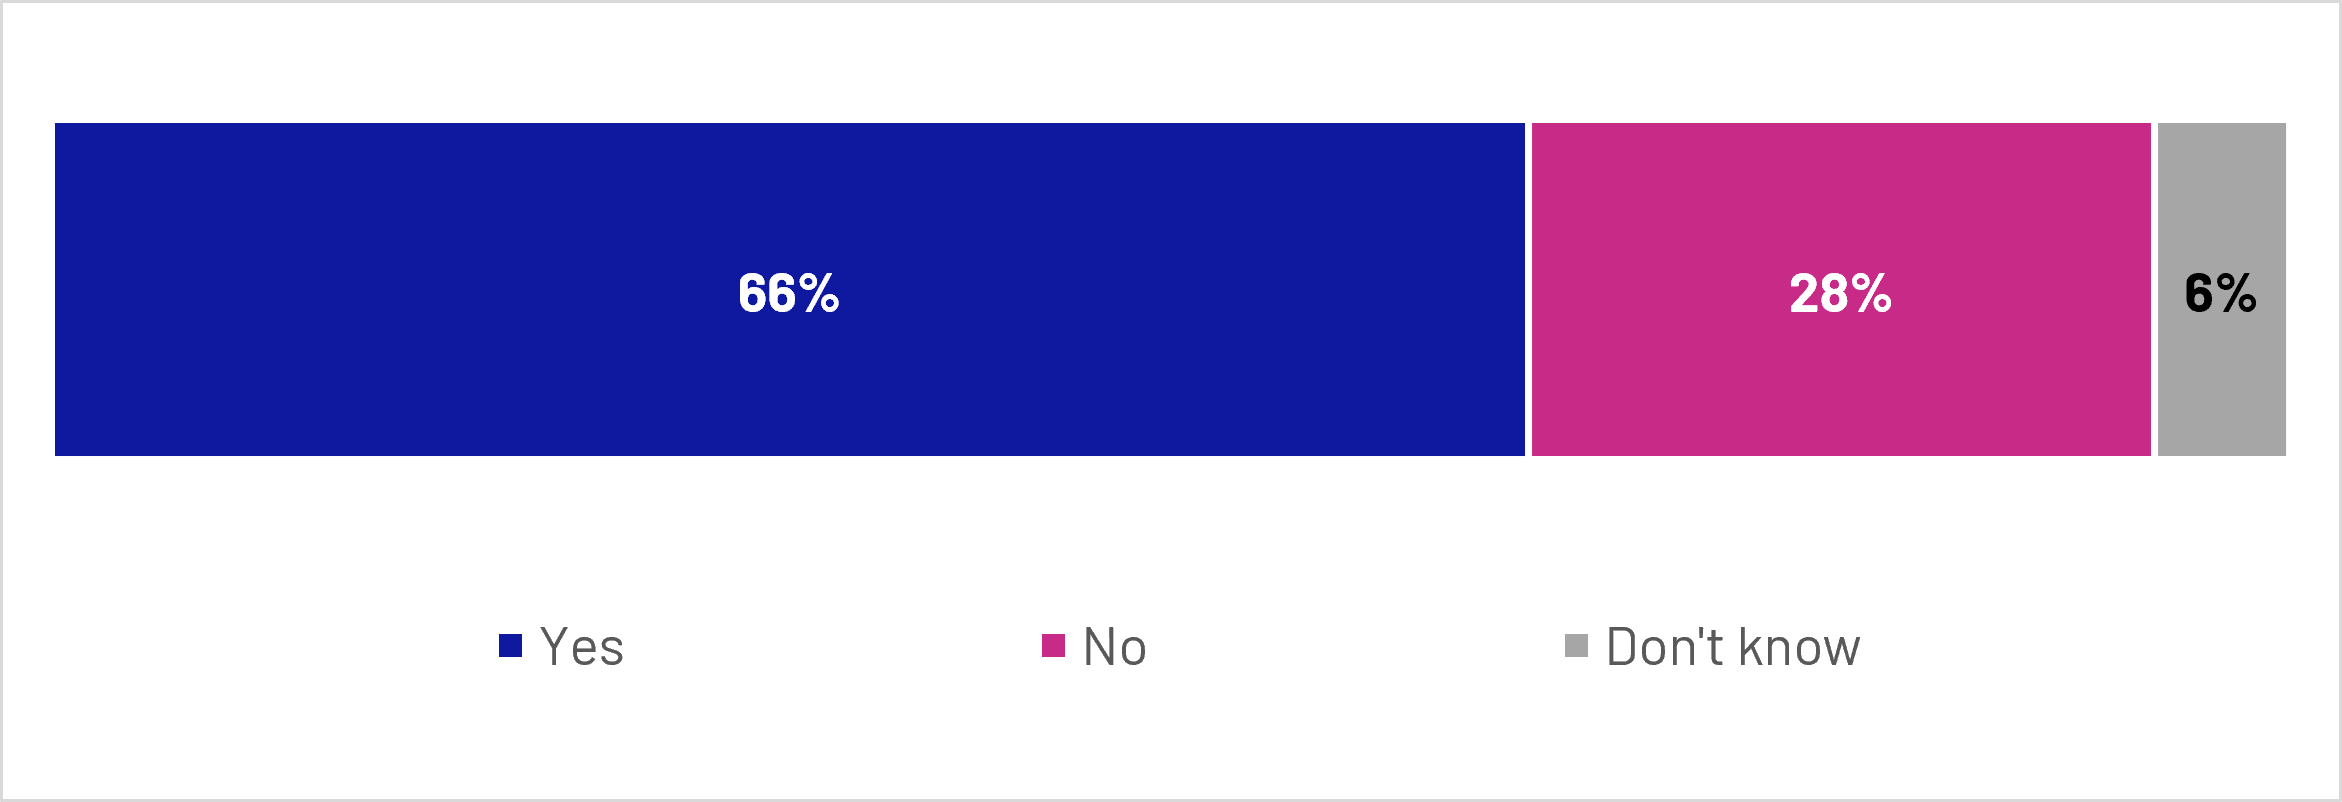
Figure 7.3: As a result of seeing pensions that need action, do you understand what you need to do next?
Base: All who saw pensions that need action in the MHPD results (Q26) (n=92 unweighted)
Stacked bar chart:
- Yes: 66%
- No: 28%
- Don't know: 6%
This finding highlights an important support need. While the dashboard was successful in identifying pensions that required follow-up, not all users felt sufficiently informed or confident to act on that information independently. For some, additional guidance may be required to help translate awareness into action.
Despite this uncertainty, most users who identified pensions requiring action indicated an intention to follow up. Around 29% had already contacted the relevant pension provider, while a further 52% intended to do so in the future. Only 15% stated that they did not plan to follow up. These findings suggest that identifying a specific issue through the dashboard can be a strong trigger for engagement, even where users require additional support to navigate the next steps.
Looking beyond dashboard-specific actions, findings from the wider Wave 2 survey suggest that dashboard users were generally more engaged with their pensions than non-users. Users were more likely to have undertaken each of the pension-related activities measured in the survey, and only 8% reported taking none of the listed pension actions during the previous 12 months, compared with around a third (34%) of non-users.
Back to top8. Conclusions
The findings provide early evidence that pensions dashboards can support greater engagement with pensions and retirement planning. While uptake and outcomes are currently strongest among consumers who are already relatively engaged with their pensions, the dashboard demonstrates clear potential to improve awareness, understanding and retirement planning behaviours when consumers successfully access and use the service.
8.1 Who currently benefits the most from dashboards?
The findings suggest that dashboards are currently attracting consumers who are already more engaged with their retirement finances. Users were generally more engaged with pensions before accessing the dashboard and were more likely to report stronger pension understanding and retirement planning behaviours. Qualitative findings support this interpretation, showing that many users approached the dashboard with a pre-existing interest in understanding and managing their pension arrangements. Key Driver Analysis also reinforces the interpretation, finding that confidence in pension contributions, engagement with pension information and information-seeking behaviours were among the strongest predictors of dashboard uptake.
However, the results also suggest that dashboards appeal to a wider group than those already actively engaged with retirement planning. Even among non-completers, participants generally understood the value of bringing pension information together in one place and often expressed interest in using the service to gain visibility and reassurance about their pension savings. For many, non-use reflected barriers within the access journey, particularly around identity verification and account set-up, rather than a lack of interest in the dashboard itself. The benefits experienced by users therefore indicate that dashboards are not simply serving those who are already informed; they are also helping users improve visibility over their pensions and strengthen their understanding of their retirement savings.
8.2 What drives successful access and use?
Successful access was associated with higher levels of pension engagement, planning and confidence before dashboard use. However, Key Driver Analysis suggests that once consumers attempt to access the dashboard, practical readiness becomes increasingly important. The single strongest predictor of successful completion was already having established a GOV.UK One Login account and completing the identity verification, which was substantially more influential than any other factor in the model. Those who already had a retirement plan, understood pensions, or belonged to more engaged MaPS segments were significantly more likely to successfully access the dashboard.
For those who did not complete the process, barriers were typically practical rather than attitudinal. Common reasons included running out of time, length or complexity of the process, technical issues, and challenges relating to GOV.UK One Login account creation or identity verification. Qualitative findings reinforced this pattern. Participants often described the dashboard itself as useful and appealing, particularly as a way of bringing pension information together in one place but reported dropping out because they were unprepared for the identity verification process, did not have the required information available, or felt the process required more time and effort than expected.
Among those who never attempted to access the dashboard, lack of time was the dominant reason, followed by a belief that they already understood their pensions and a lack of interest in using the service. However, qualitative interviews suggested that even many non-users understood the value of the dashboard and expressed an interest in using it to gain visibility and reassurance about their pension savings.
This suggests that dashboard uptake is shaped by both consumer motivation and the ease of the access journey. Consistent with the Key Driver Analysis, engagement with pensions appears to drive initial interest in using the dashboard, while successful completion also depends on consumers’ ability to navigate practical requirements such as GOV.UK One Login and identity verification. Robust identity verification is essential given the sensitive personal and financial information made available through the dashboard. However, even interested users may fail to complete the journey when the verification process or other stages create friction, present technical issues or are difficult to navigate.
8.3 What outcomes are dashboards generating?
The findings indicate that dashboard use is associated with a number of positive early outcomes. Compared with non-users, users reported stronger awareness of their pensions, higher levels of confidence across a range of pension topics, and greater engagement with retirement planning. Users were also more likely to understand enough about pensions to make saving decisions and were more likely to have a clear or rough plan for retirement.
The user experience was generally positive, with three quarters satisfied overall and most users reporting that they found the information clear and useful. The dashboard appears particularly effective in helping users understand where their pensions are held and in bringing together information that was previously dispersed across multiple providers. Qualitative findings suggest that, for many users, the primary benefit was not substantial new learning but greater visibility, reassurance and confidence. Bringing pension information together in one place helped users confirm that their pension arrangements matched their expectations and provided reassurance that they were on track with their retirement savings.
Importantly, dashboard use also prompted action. More than half of users reported taking at least one action as a result of accessing the service, most commonly thinking more about retirement planning, seeking further information, or reviewing pension details. Qualitative findings suggest that these actions were often exploratory rather than transformational. Users commonly described checking pension information, investigating missing pensions, seeking additional guidance or reflecting on whether their retirement plans were sufficient. While a smaller group reported gaining genuinely new insights that prompted reconsideration of their retirement finances, the more typical outcome was increased confidence and engagement rather than immediate behavioural change.
Taken together, the findings suggest that dashboards are most effective as a catalyst for engagement and informed decision-making. Their immediate value appears to lie in consolidating information, providing reassurance and encouraging reflection on retirement planning, with more substantial behavioural impacts likely to develop over a longer period of time.
8.4 Where is additional support and guidance needed?
Despite generally positive experiences, several areas highlight the need for continued support and development. First, many consumers remain disengaged from pensions more broadly, with baseline findings showing substantial levels of confusion, uncertainty and limited retirement planning. As such, attracting less engaged consumers remains a key challenge. This is particularly important given that the consumers who stand to benefit most from pension dashboards are often those with the lowest levels of pensions knowledge, confidence and engagement. However, both the quantitative and qualitative findings suggest that dashboard users tended to be more engaged with pensions than non-users even before accessing the service. Qualitative research suggested that while many non-users understood the value of bringing pension information together in one place, competing priorities often reduced the perceived urgency of engaging with the dashboard. Increasing uptake may therefore require not only raising awareness of the service but also helping consumers recognise the relevance of pension planning to their own circumstances and demonstrating the value that dashboards can provide to those who are least engaged.
Second, some users experienced uncertainty after receiving their dashboard results. Among those who saw pensions requiring action, more than one quarter (28%) did not know what they needed to do next. This suggests that identifying an issue is not always sufficient and that users may require clearer guidance and signposting to help convert awareness into action. Qualitative findings reinforced this conclusion, with some participants reporting uncertainty about the significance of missing pensions, what steps were required to resolve issues, or how to act on the information presented. While the dashboard was effective at highlighting issues, users did not always feel confident about what should happen next. Several participants subsequently contacted pension providers to investigate missing pensions, verify pension details or explore pension consolidation, suggesting that users often needed to seek additional information elsewhere before feeling able to act.
Finally, pensions perceived to be missing and concerns about the completeness or recency of information remain important drivers of dissatisfaction. Around one third of users reported pensions they expected to see were missing, while perceptions of up-to-date pension values received lower ratings than other aspects of the dashboard experience. Qualitative research suggests that perceived gaps in results could undermine the reassurance and confidence that many users sought from the dashboard. Participants often viewed the dashboard as a means of confirming that all of their pension information was present and accurate, meaning that missing records could create uncertainty and reduce trust in the results. Continued expansion of pension scheme coverage and clear communication about dashboard limitations will therefore be important for maintaining confidence in the completeness and reliability of dashboard information.
Overall, the findings suggest that pensions dashboards have the potential to play an important role in improving consumers' understanding of, and engagement with, their retirement finances. The greatest value currently appears to be in helping users bring together pension information, build awareness of their pension arrangements and prompt further engagement with retirement planning. Qualitative findings suggest that this value is often realised through increased visibility, reassurance and confidence, rather than through immediate behavioural change. Qualitative and quantitative findings suggest that any actions prompted by dashboard use tend to be reflective and considered, supporting longer-term engagement with retirement planning rather than triggering immediate financial decision-making. However, realising the full potential of dashboards will depend not only on broadening access beyond already engaged consumers, but also on ensuring that users can successfully navigate the access journey and are supported in understanding and acting on the information they receive.
Back to top