Test harness testing guide
Overview
This is the test harness testing guide. Its intended audience is system administrators and testers at directly connecting organisations (DCOs).
The central digital architecture (CDA) stub can be used by DCOs during system testing. It implements the consent and authorisation API, which the system-under-test will interact with.
It also provides ways to check the behaviour of that system so testers can verify that each test scenario passes. There are two main mechanisms to assert the correct behaviour:
- The call log. This is a log of all the HTTP calls (and responses) made to the CDA stub. By inspecting the log, a tester can verify that the expected calls were made with the correct parameters and correct responses.
- The CDA stub internal database. As calls are made to the CDA stub, data is stored and updated in its internal database. This can be queried to verify that the correct calls were made by the system-under-test.
Downloads
Download error-scenarios-postman-collection.zip
This zip folder contains:
- 8. MaPS System Testing - Error scenarios.postman_collection (1).json
Download crypto-pack-for-system-testing.zip
This zip folder contains:
- certificate.json
- certificateChain.json
- certPrivateKey.json
- certPublicKey.json
- jwtPrivateKey.json
- jwtPublicKey.json
- kid.json
Download supplementary-crypto-material-for-system-testing.zip
This zip folder contains:
- postmanCertificate_expired.key.pem
- postmanCertificate_expired.pem
- postmanCertificate_invalid.key.pem
- postmanCertificate_invalid.pem
- postmanCertificate_valid.key.pem
- postmanCertificate_valid.pem
- README.md
- SUT_trusted_CA.pem
Prerequisite: starting the CDA stub
For instructions on setting up and running the CDA stub, refer to the accompanying test harness administrator guide.
This chapter assumes that the CDA stub is up-and-running, and that the call log is configured to be accessible. We assume the system-under-test is configured to use it instead of the real consent and authorisation, ready for the test scenarios to be tested.
Back to topRunning the test scenarios for technical standards system testing
It is assumed that the test scenarios will be run one at a time. This allows the checks to be made more easily against the CDA stub, as the calls made and resources created/edited during that specific test scenario can be easily identified.
Each test scenario is defined in the test pack, in the accompanying test scenarios.
Columns “Request log output” and “Response log output” give details of the expected interaction with the CDA stub, and thus what to assert.
To collect evidence that each scenario has been run successfully, it is recommended to copy from the CDA stub call log the requests and responses sent during that scenario. These can be added to the evidence document submitted to MaPS to say that system testing has been completed successfully.
View request parameters (system testing)
For some test scenarios, the ‘view’ requests sent with Postman require parameters to be set that match resources created during a previous ‘find’. The tester must look up these values and configure the Postman request accordingly.
Asset GUID (resource ID)
For some ‘view’ test scenarios, the Asset GUID needs to be supplied in the Postman call. If you are using the dummy ISP created for testing the test harness, this must match the resource created from a corresponding previous find request. If you are sending the Postman call to a genuine Resource Server, use the Asset GUID generated by the Resource Server when the pension match was registered.
This is shown in the Postman request’s URL path as {{asset_guid}}.
One way to retrieve this is to use the CDA stub call log. When handling the ‘find’ request, there will have been a call to the /rreguri endpoint. The response to this will show the resource ID. For example, see the example below (with the resource_id highlighted):
2024-08-22 13:24:40.334 - consent and authorisation stub v1.1.4- SNAPSHOT. Processing POST request to /rreguri with x-request-id: d1add5ef-aa96-4862-8709-b5b0172cdaee
REQUEST DETAILS
Transport information: secured (https TLSv1.2). Client authentication: NEED. Client CNs: [CN=casstubclient]
Request ID: d1add5ef-aa96-4862-8709-b5b0172cdaee
Request URI: /rreguri
Request Method: POST
* Headers:
x-request-id: d1add5ef-aa96-4862-8709-b5b0172cdaee
authorization: Bearer eyJhbGciOiJIUzI1NiIsInR5cCI6IkpXVCJ9.eyJzdWIiOiIxMjM0NTY3ODkwIiwibmFt ZSI6ImhhcHB5X3BhdGhfMjAiLCJpYXQiOjE1MTYyMzkwMjJ9.5JkW4IbxLAyogP9PGLmw 3c9MeKLReEt0ZW1Op97b3ek
content-length: 253
host: casstubserver:8443
connection: keep-alive
content-type: application/json accept-encoding: gzip, deflate
user-agent: python-requests/2.32.3
accept: */*
* Request Parameters:
match_status: match-yes
RESPONSE DETAILS
Response Status: 201
Response Content Type: application/json;charset=UTF-8
Response Content Encoding: UTF-8
Response Content Length: 54
* Response JSON:
resource_id: f1dcc5e7-d747-4041-9a69-a114fc6573cc
Setting the request party access token (RPT)
For some ‘view’ test scenarios (for example, scenario 29 and 30), the Postman call needs to be configured with the RPT. It must match the resource created from a previous find request.
In production usage, the system-under-test would not need to worry about retrieving the RPT: the system will receive find and view requests (it is the responsibility of other systems to ensure a valid RPT is passed).
However, the tester must send valid find and view requests to exercise the system-under-test. This means the tester has the extra responsibility of ensuring the RPT in the view request matches the RPT generated by the previous find request.
Before sending the ‘view’ request, the tester must ensure that an appropriate “find” request has been processed.
The simplest way for the tester to retrieve the RPT is by querying the database directly. After running the find scenario, the tester can execute the following database query (substituting in the resource_id that was returned in the response to the /rreguri request):
SELECT RPT FROM CAS_REGISTERED_RESOURCE where RESOURCE_ID=‘$RESOURCE_ID’
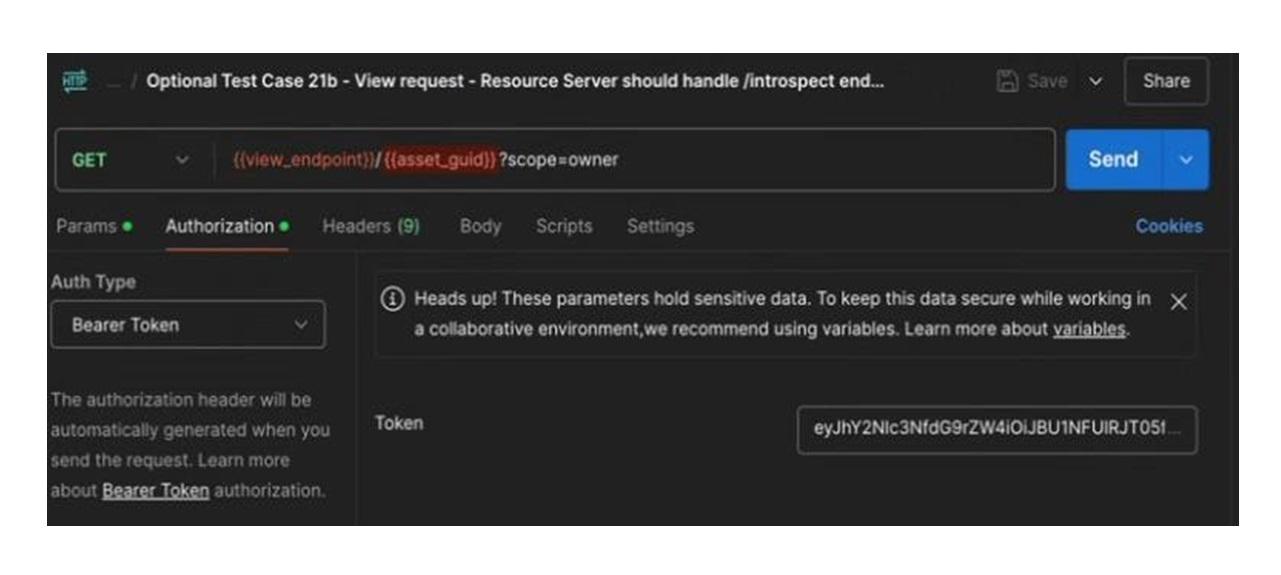
To use the RPT in the Postman view request, set the authorization Bearer Token of that Postman request to the RPT for the resource.
The Auth Type is set to “Bearer Token”, and the “Token” value is set the RPT (in the screenshot below, this is the value beginning “eyJhY…”).
Error handling scenarios for system testing
The error handling scenarios are chosen to give good coverage without asking testers to run through every permutation.
The CDA stub supports simulating other error scenarios. For example, as well as simulating a 500 error, it can simulate a 502, 503 and 504 error.
The error behaviour in the CDA stub is triggered by using pre-defined UAT (user account tokens) and RPT (request party access token). When that specific UAT or RPT is received, it causes the CDA stub to return the pre-defined error code.
Testers can create variants of the supplied test scenarios by adjusting the UAT and/or RPT in that scenario.
Variants of ‘find’ error scenarios
To find the alternative UATs for ‘find’ scenarios, query the CDA stub internal database. Query the CAS_USER table to get the UAT. The friendly name indicates which error this will produce, such as “Assertion User for /rreguri POST 502 bad gateway scenario”.
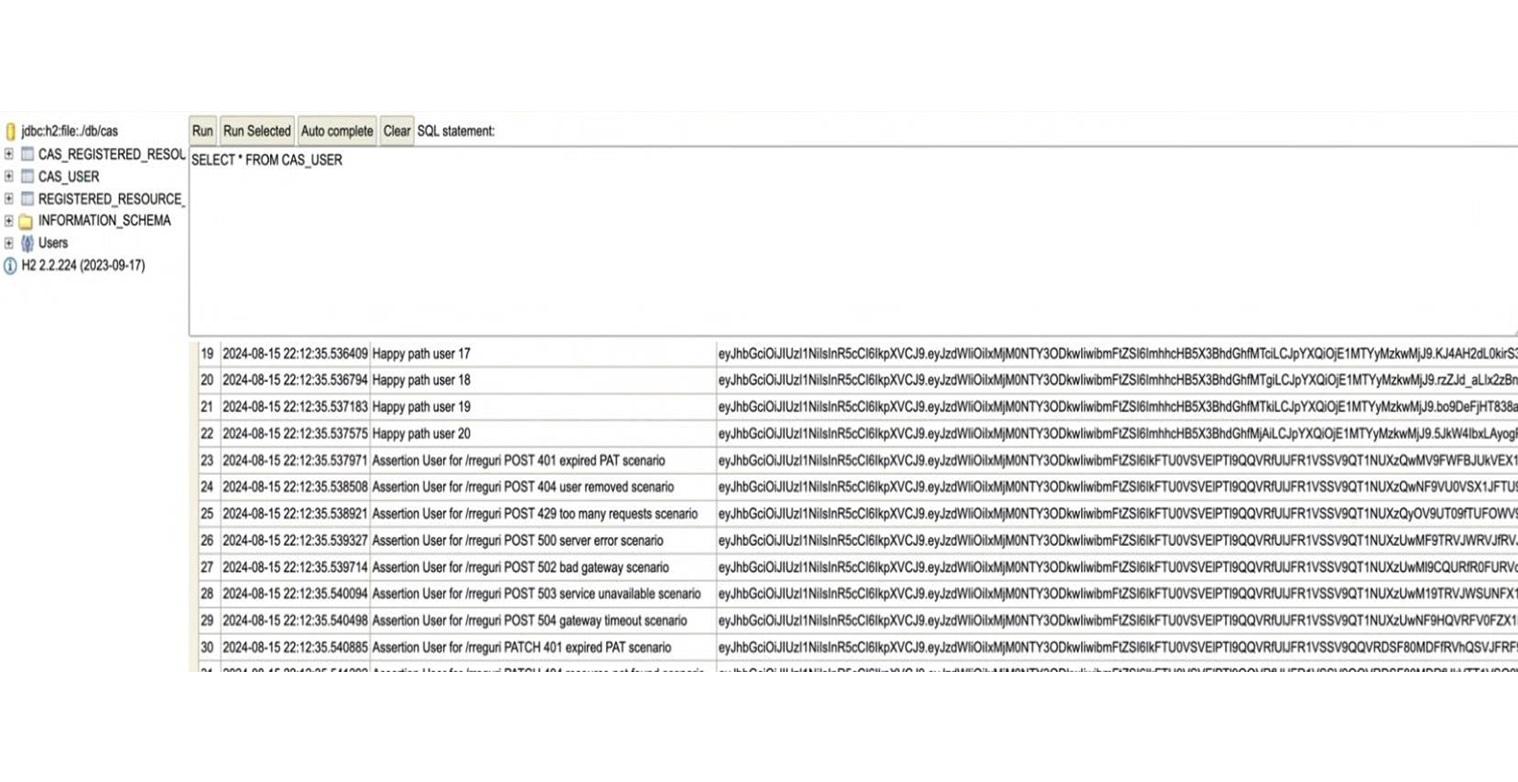
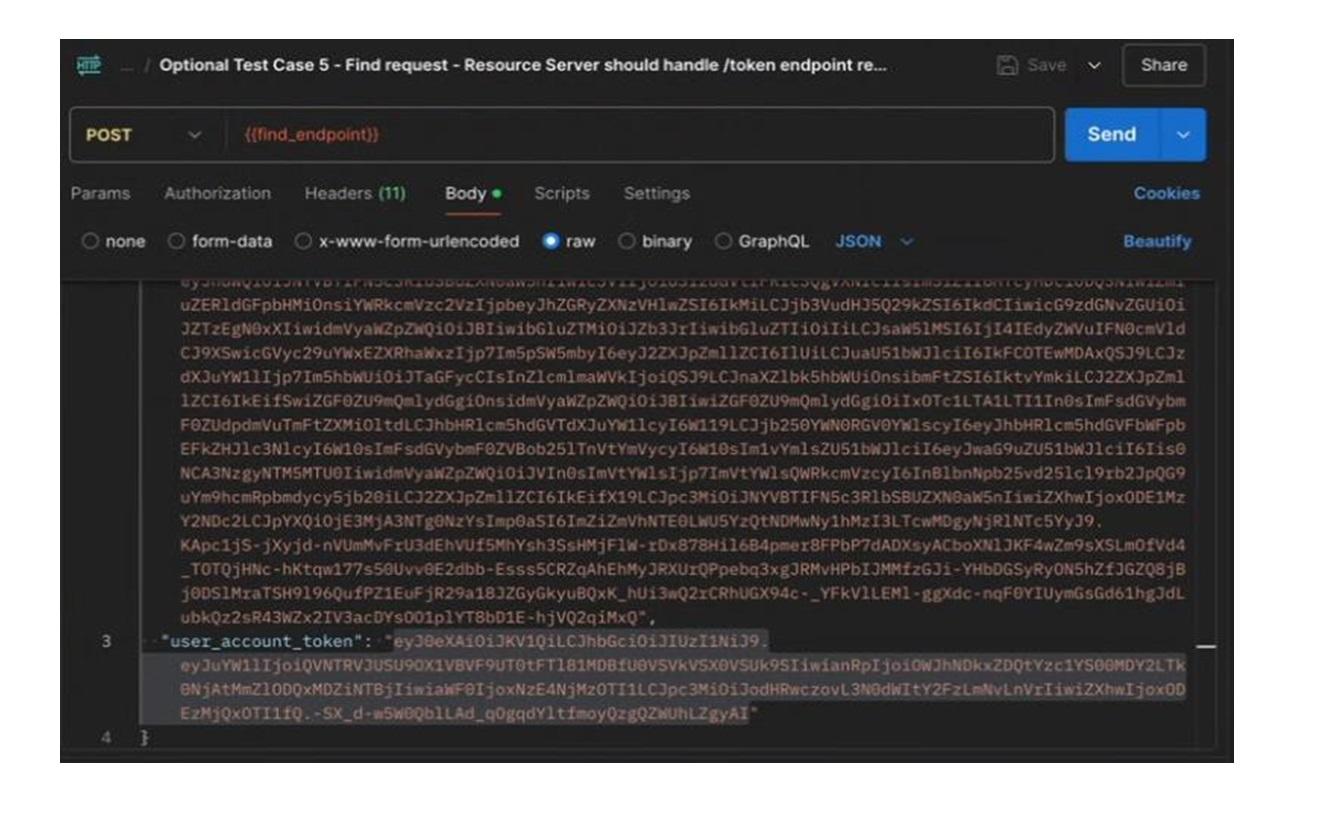
To configure this within the Postman ‘find’ request, edit the body of the request to change the ‘user_account_token’ value, to use the desired UAT.
Variants of ‘view’ error scenarios for /introspect failing
To find the alternative RPT for ‘view’ error scenarios where the /introspect endpoint fails (for example, error scenario 21), query the CDA stub internal database. Query the CAS_REGISTERED_RESOURCE table to get the RPT. The friendly name indicates which error this will produce, such as “assertion user for /introspect 502 bad gateway scenario”.
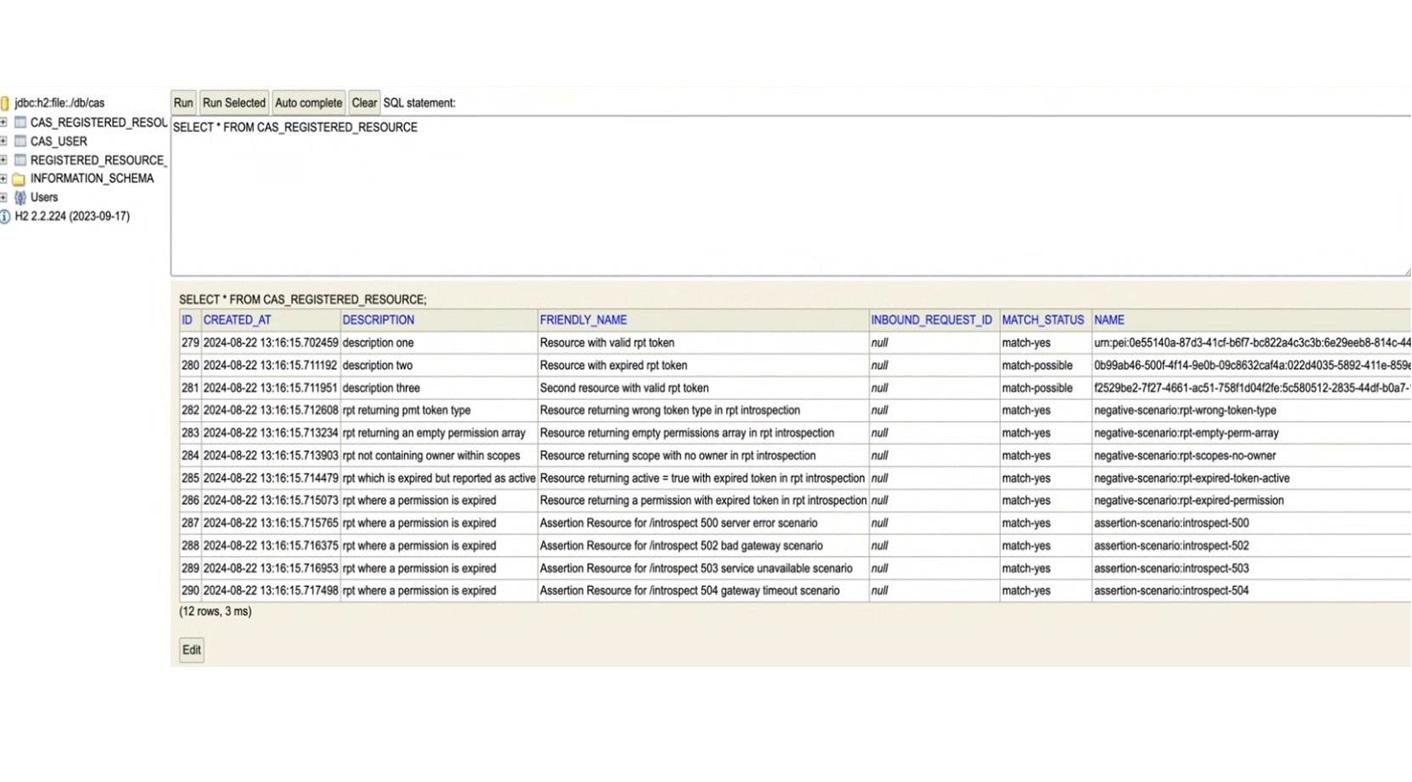
To configure this within the Postman ‘view’ request, set the authorization Bearer Token of that Postman request to the RPT for the resource (as described in setting the RPT).
Variants of ‘view’ error scenarios for /perm failing
For ‘view’ error scenarios where the /perm endpoint fails (for example, error scenario 22-24), this is controlled by the UAT used in the original ‘find’. Based on that UAT, a specific PAT will have been returned, and that PAT will be used by the system-under-test when subsequently handling the ‘view’.
To get the appropriate UAT, query the CDA stub internal database. Query the CAS_USER table, and find the row with the friendly name being in the form 'Assertion User for /perm 50x <reason> scenario'. Get the user account token (UAT) in that row.
To configure this within the Postman ‘find’ request, edit the body of the request to change the ‘user_account_token’ value, to use the desired UAT.
Back to topRunning the test scenarios for reporting standards system testing
It is assumed that the test scenarios will be run one at a time. This allows the checks to be made more easily against the CDA stub, as the calls made and resources created/edited during that specific test scenario can be easily identified.
The tests that expect response 202 (accepted) are quite straightforward:
- Send the defined request.
- Verify the response is as expected (202).
- Capture the test harness logs for test evidence.
There are tests that are specific for handling error responses. To this end, there is a /configuration endpoint which will allow the DCO to test error response handling. This will only configure the 6 endpoints listed in the reporting standards. These have a new style of error response payloads. For testing error scenarios in the endpoints defined in the technical standards, the original approach of using particular UAT and RPT values is still valid.
For tests that show handling of an error response that should not trigger retries:
- Configure the reporting endpoint to return the specific error code.
- Send the defined request.
- Verify the response is as expected (error response).
- Wait 30 seconds to see if there is a retry.
- Capture the test harness logs for test evidence, demonstrating that there were no retries of that request.
For tests that show handling of an error response that should trigger retries but ultimately succeeds with response 202 (accepted):
- Configure the reporting endpoint to return the specific error code for the required number of retries.
- Send the defined request.
- Verify the response is as expected (error response).
- Wait for retries (error response).
- Wait for eventual success (202).
- Capture the test harness logs for test evidence, demonstrating that there were the expected number of retries of that request, followed by success (202).
For tests that show handling of an error response that should trigger retries but ultimately sends the maximum number of retries:
- Configure the reporting endpoint to return the specific error code for the required number of retries.
- Send the defined request.
- Verify the response is as expected (error response).
- Wait for maximum number of retries (error response).
- Wait to see if there are further retries.
- Capture the test harness logs for test evidence, demonstrating that there were the expected number of retries of that request, all with the error response.
The error configuration endpoint
The configuration will allow up to 6 endpoints configuration at any one time. For each endpoint, the configuration will include:
- the endpoint
- the response code
- the response body
- the number of times the endpoint will return the error before returning to normal behaviour.
The endpoint is hosted on the CDA stub at /configuration.
No X-Request-ID is required for this endpoint.
If the CDA was hosted locally with port 8081, the request would be:
The payload is an array of configurations. This is a sample configuration for a single endpoint:
[
{
"endpoint": "/service-availability/find",
"status": 400,
"code": "InvalidRecordIdError",
"count": 1,
"errors": [
{
"code": "INVALID_RECORD_ID"
}
]
}
]
For this configuration, the next call to /service-availability/find will result in the response:
{
"type": "https://example.com/errors/InvalidRecordIdError",
"title": "Invalidrecordiderror",
"status": 400,
"timestamp": "2026-03-09T16:50:02.319Z",
"errors": [
{
"code": "INVALID_RECORD_ID"
}
]
}
Note the new format for error response payload. So far, this has only been applied to the new reporting endpoints; the endpoints defined in the technical standards still return the old-style error response payloads.
Given the count supplied in the configuration was 1, the endpoint will only return this error for a valid request once. After this, the endpoint will return the 202 (accepted) response to any valid request.
This allows the DCO to test error handling without compromising their own request code.
It is possible to reset all reporting endpoints to their correct behaviour by sending an empty array for the payload:
[]
After this, any valid request to any reporting endpoint will succeed with status 202 (accepted).
Back to topCall log
The http.log contains a record of all the http requests (and responses) made to the CDA stub. This log file needs to be checked to confirm the expected calls were made during a test scenario.
Example call and response
Below is an example from the call log:
2024-08-15 08:11:05.811 - consent and authorisation stub v1.1.3. Processing POST request to /rreguri with x-request-id: 85bd18da-83a6-43ed-b6f1- a4b56f6e024e
REQUEST DETAILS
Transport information: secured (https TLSv1.3). Client authentication: NEED. Client CNs: [CN=casstubclient]
Request ID: 85bd18da-83a6-43ed-b6f1-a4b56f6e024e
* Headers:
x-request-id: 85bd18da-83a6-43ed-b6f1-a4b56f6e024e authorization: Bearer
eyJhbGciOiJIUzI1NiIsInR5cCI6IkpXVCJ9.eyJzdWIiOiIxMjM0NTY3ODkwIiwibmFtZSI6Imh hcHB5X3BhdGhfMDIiLCJpYXQiOjE1MTYyMzkwMjJ9.RG- 5z6TixeTBX_V4bkM5HMC7zlN_E6b98EG6RulMZuc
content-length: 234 host: localhost:8081 connection: keep-alive
content-type: application/json accept-encoding: gzip, deflate user-agent: python-requests/2.32.3 accept: */*
* Request Parameters:
match_status: match_yes
RESPONSE DETAILS
Response Status: 201
Response Content Type: application/json;charset=UTF-8
Response Content Encoding: UTF-8
Response Content Length: 54
* Response JSON:
resource_id: fdcaecf4-f3bc-4313-97f5-9a69cd5b3251
An understanding of HTTP requests and responses is assumed, to be able to interpret the output. For those less familiar with HTTP requests, there are many online tutorials and guides such as this guide from Mozilla.
Below are some pointers, to help testers more easily read and interpret this output:
- timestamp: each logged request begins with a timestamp, to millisecond accuracy. This is useful for ensuring that the given request is part of this scenario run. It is also useful for correlating the logs of the system-under-test with that of the CDA stub.
- application version: identifies the version of the CDA stub running
- transport information: shows the transport layer security data, including if it is secured or not, the schema and protocol used, the configuration of the client authentication and the subject of the client certificate sending the request
- request URI: this gives the endpoint (the path) that was called, such as “/rreguri” or “/token”
- request method: indicates whether this was a GET, POST, PATCH or DELETE request.
- headers
- x-request-id: This is the unique ID (generated by the system-under-test) for this request. It can potentially be used to correlate logs in the system-under-test with the CDA stub logs
- authorisation: most of the request needs to be authorised to perform the action on the underlying resource. The PAT associated with the resource needs to be sent in the authorization header
- “request body parameters” (or “request parameters” or “input parameters”): input parameter values used in the request. It will be important to check that the expected values are used for selected parameters
- response status: the status code for the HTTP response (returned by the CDA stub to the system-under-test)
- “response JSON”: the response payload returned (in simplified human-readable form)
- “response text”: the response payload returned if it is not JSON
Interpreting the test scenario checks
Each documented test scenario contains the key data to be expected on each request and response.
An example in the request log would be:
POST /token Input Parameters:
- grant_type: urn:ietf:params:oauth:grant-type:jwt-bearer
- scope: uma_protection
- assertion: ${USER_ACCOUNT_TOKEN}
This should be interpreted as:
- request method must be POST
- request URI must be “/token”
- “request body parameters” (or “request parameters”) must contain those three parameters with the associated value.
Where a value is written as ${...} (for example, ${USER_ACCOUNT_TOKEN}, it represents an expected value that is not hard-coded. In this example, it is the user token that was passed to the system-under-test in the find request.
An example in the response log:
Status: 200
access_token: ${USER_PAT}
token_type: pension_dashboard_pat
This should be interpreted as:
- response status must be 200
- the response JSON must include access_token whose value is the user’s PAT
- the response JSON must include token_type whose value is “pension_dashboard_pat”
The CDA stub internal database
As calls are made to the CDA stub, data is stored and updated in its internal database. This can be queried to verify that the correct calls were made by the system-under-test.
A database console is available for interacting with the database (for background information on this database and its console, see the H2 database documentation).
By inspecting and querying this database, the tester can see resources stored before and after each scenario. This allows the tester to check that the system-under-test did as expected.
Note that this database is transient: if the consent and authorisation container is terminated and run again, the database contents will be reset to the default initial values.
The database contains the following tables:
- CAS_USER: contains the preloaded users with their USER_ACCOUNT_TOKEN and PAT tokens. Most of the endpoints expect to be authenticated providing an existing PAT on the database. The token endpoint will provide the PAT associated with a USER_ACCOUNT_TOKEN.
- CAS_REGISTERED_RESOURCE: contains the preloaded resources stored, available to be used for specific test scenarios, as well as data added/modified using the API. This is the table where the tester must check what information is stored to check the behaviour is the expected.
The H2 console supports SQL queries. By clicking in the table name, it will pre-populate the query area with a basic `SELECT * FROM $TABLE` to list all the resources.
Interpreting the test scenario checks
Each documented test scenario contains the key data to be expected on each request and response. The test steps include wording such as:
- “take a note of the resources on CDA stub”
- “check the CDA stub resources”
This means viewing the registered resources in the database (which were created, modified and/or deleted by calls to the /rreguri endpoint).
Depending on the scenario, the expectation is that resources will have been created or modified; or in some cases the assertion will be that no additional resources were created during the test scenario.
Viewing the registered resources
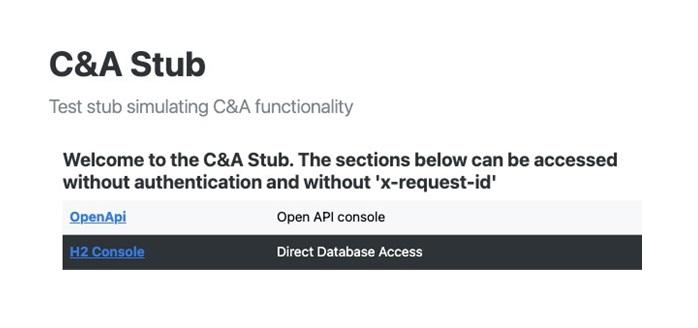
For accessing the console, open the URL where the stub is deployed and click on the H2 console link.
The login form will be presented. The defaults will be correct, unless the container has been configured with alternative values (such as a custom username and password).
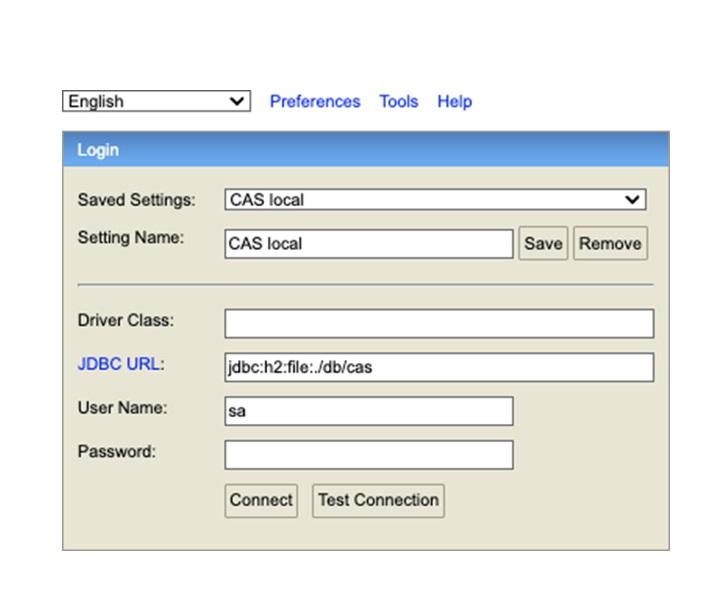
Once connected, the query console is available to interact with the database.
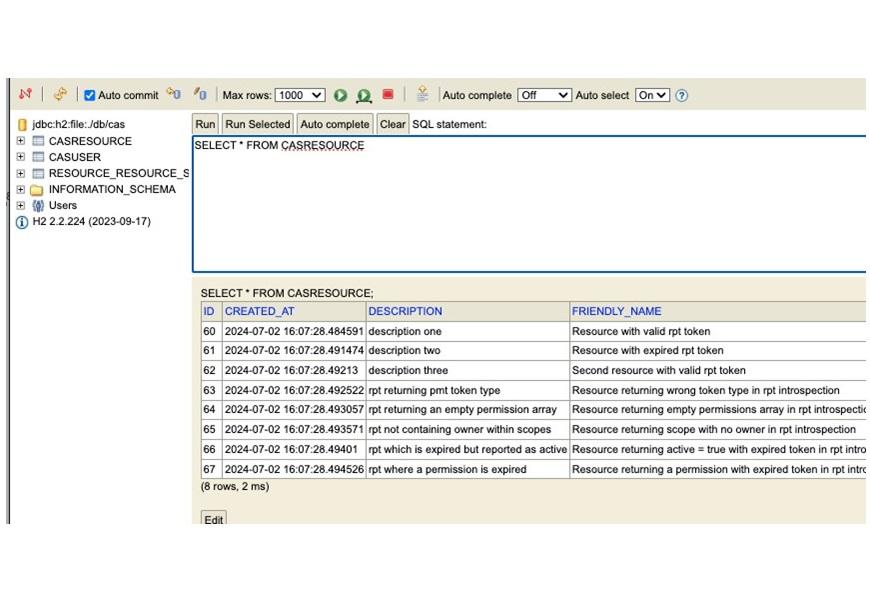
By clicking on the table name, the console will auto-populate a query for selecting all the rows in the table. Clicking in the column name will order the presented results by that field.
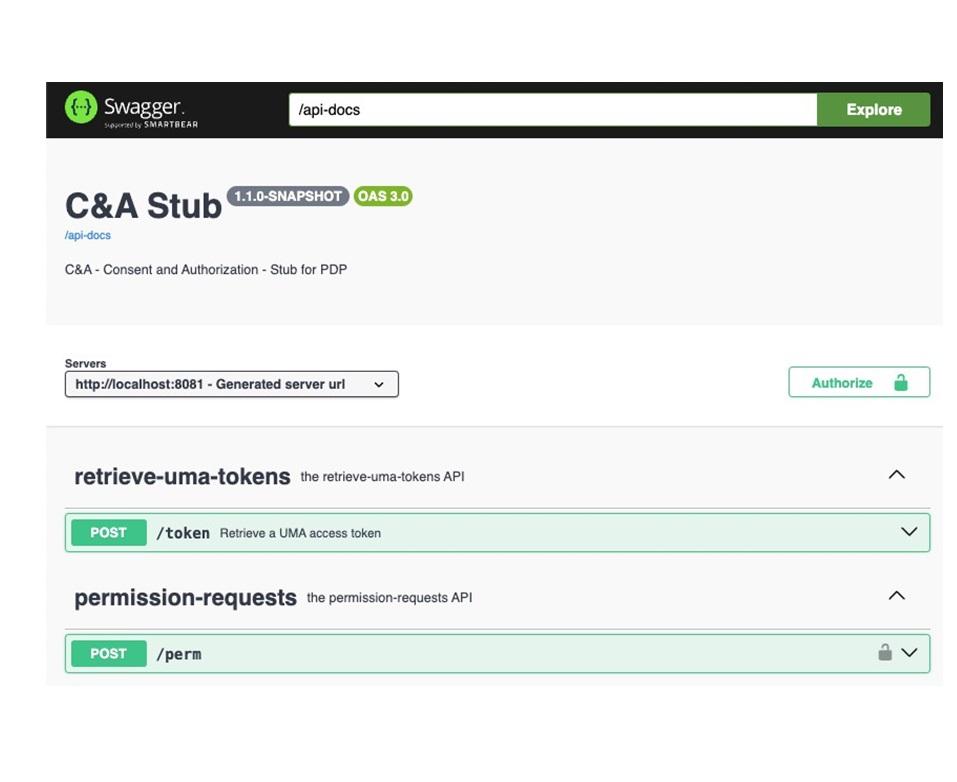
Back to topOpen API console
The CDA stub exposes an Open API console, which can be used to browse and interact with the CDA stub through its API. This standard swagger interface shows the endpoints, including documentation of each.
Note: MaPS's technical specification is the source of truth and definitive documentation for the consent and authorisation API.
While working through the test scenarios, the tester will normally have no need to view or use the Open API console. However, in the event of troubleshooting test failures and problems, this console could prove useful to test API calls and to see the responses.
Note that the new reporting endpoints do not present details or examples. To view these, it is advised to paste the latest version of the Open API into SwaggerEditor and view examples and schema there.
Back to topTroubleshooting failing tests
If a test scenario fails, the CDA stub’s internal database and call log should give a clear view of the interactions from the system-under-test and thus which assertions failed.
Those failures, and the expected calls, can be further explored by the tester or developers by making calls manually against the CDA stub. You would do this to test variants of the call, to see how the CDA stub will respond.
These manual calls can be done via the Open API console or via direct HTTP calls, such as using Postman or cURL like the example below (for simplicity, it assumes the domain name “example.com” and port 8443):
curl -X 'POST' \
'http://example.com:8081/rreguri' \
-H 'accept: application/json;charset=UTF-8' \
-H 'X-Request-ID: 05e0dedf-7369-4578-84ad-402f4d9d9d4b' \
-H 'Authorization: Bearer eyJhbGciOiJIUzI1NiIsInR5cCI6IkpXVCJ9.eyJzdWIiOiIxMjM0NTY3ODkwIiwibmFt ZSI6ImhhcHB5X3BhdGhfMDEiLCJpYXQiOjE1MTYyMzkwMjJ9.PUew0CeXIRdGxtwQhqaz V7shV_rL7SlKYIzkRzmomTs' \
-H 'Content-Type: application/json;charset=UTF-8' \
-d '{
"name": "urn:pei:a704ecce-06c0-46ad-a399-ab9eb43568df:a3f38ece- b586-45a6-890c-4b4c045747c8",
"description": "My Pension Scheme",
"match_status": "match-yes",
"inbound_request_id": "8731ed9c-ba83-4c8f-8735-82ae078fd5c9",
"resource_scopes": [
"owner"
]
}'
mTLS errors in Postman
Invalid/wrong certificate
If the system-under-test rejects the Postman TLS connection because it believes the certificate is not signed by a trusted CA or it has expired, an error like that below will be shown:
Error: 1288491961184:error:10000416:SSL
routines:OPENSSL_internal:SSLV3_ALERT_CERTIFICATE_UNKNOWN:../../../..
/src/third_party/boringssl/src/ssl/tls_record.cc:592:SSL alert number 46
Suggested steps:
- Check the certificate and key being used by Postman:
- is it using the correct valid cert and key, as supplied in the supplementary crypto material?
- is it from the correct version of the test pack (such that Postman and the system-under-test are using crypto resources from the same test pack version)?
- Check the trust store of the system-under-test: has the certificateChain been correctly added?
No client certificate
If no mTLS client certificate is used by Postman, the system-under-test rejects the Postman TLS connection. An error like that below will be shown:
Error: 1288491961184:error:10000412:SSL
routines:OPENSSL_internal:SSLV3_ALERT_BAD_CERTIFICATE:../../../../src
/third_party/boringssl/src/ssl/tls_record.cc:592:SSL alert number 42
Suggested steps:
- Check the certificate and key being used by Postman:
- is it using the correct valid cert and key, as supplied in the supplementary crypto material?
- is the hostname and port configured correctly in Postman to be the system-under-test (so it uses the given mTLS cert when talking to the system-under-test)?
In both cases, the actual error code may vary depending on the implementation of the system-under-test.
Back to top